
From radiometric frame to plant decision
One suite that connects Optris infrared cameras, records every frame, runs AI pipelines on the live temperature matrix and turns the result into tags, alarms, trends and reports. Docker-native. Runs on a plant PC, a Jetson or a server. Used in steel melt shops on three continents.
Four products, one data path
Each stage is a Docker service with its own web UI and REST API. Use the acquisition alone, or the whole chain up to plant-wide analytics.
CIRA Optris Acquisition
Connects any number of Optris cameras through the OTC SDK and publishes the float32 temperature matrix, live MJPEG video and health tags.
- Web dashboard, JSON5 config
- NPZ recording, sessions via API
- Auto-reconnect, watchdog, flag control
Q-Forge Vision
Visual pipeline builder: YOLO detection, SAM segmentation, OCR, polygon math and thermal statistics on the real temperature matrix, not on a colorized picture.
- Datasets, labeling, training built in
- Runtime scheduler with plant triggers
- Models swap without downtime
Q-IND Time Vault
Millisecond-timestamped time-series store built for speed on the filesystem. Every tag, every sample, kept at full resolution and charted in seconds.
- Shape-preserving downsampling
- Annotations with attached images
- CSV export, batch API
QUANTUM Industrial Studio
Screens, alarms, expressions, sequencers, PLC drivers and an AI assistant that speaks to the same data. The thermal results become ordinary plant tags.
- S7, Allen-Bradley, Modbus, OPC UA, IEC
- 3D digital twin screens
- Unlimited tags, no per-seat cost
Built around the temperature matrix
Most software treats a thermal camera as a video source. This suite treats it as a measuring instrument: the radiometric array travels through every stage untouched.
Connect, configure, watch, record. Out of the box.
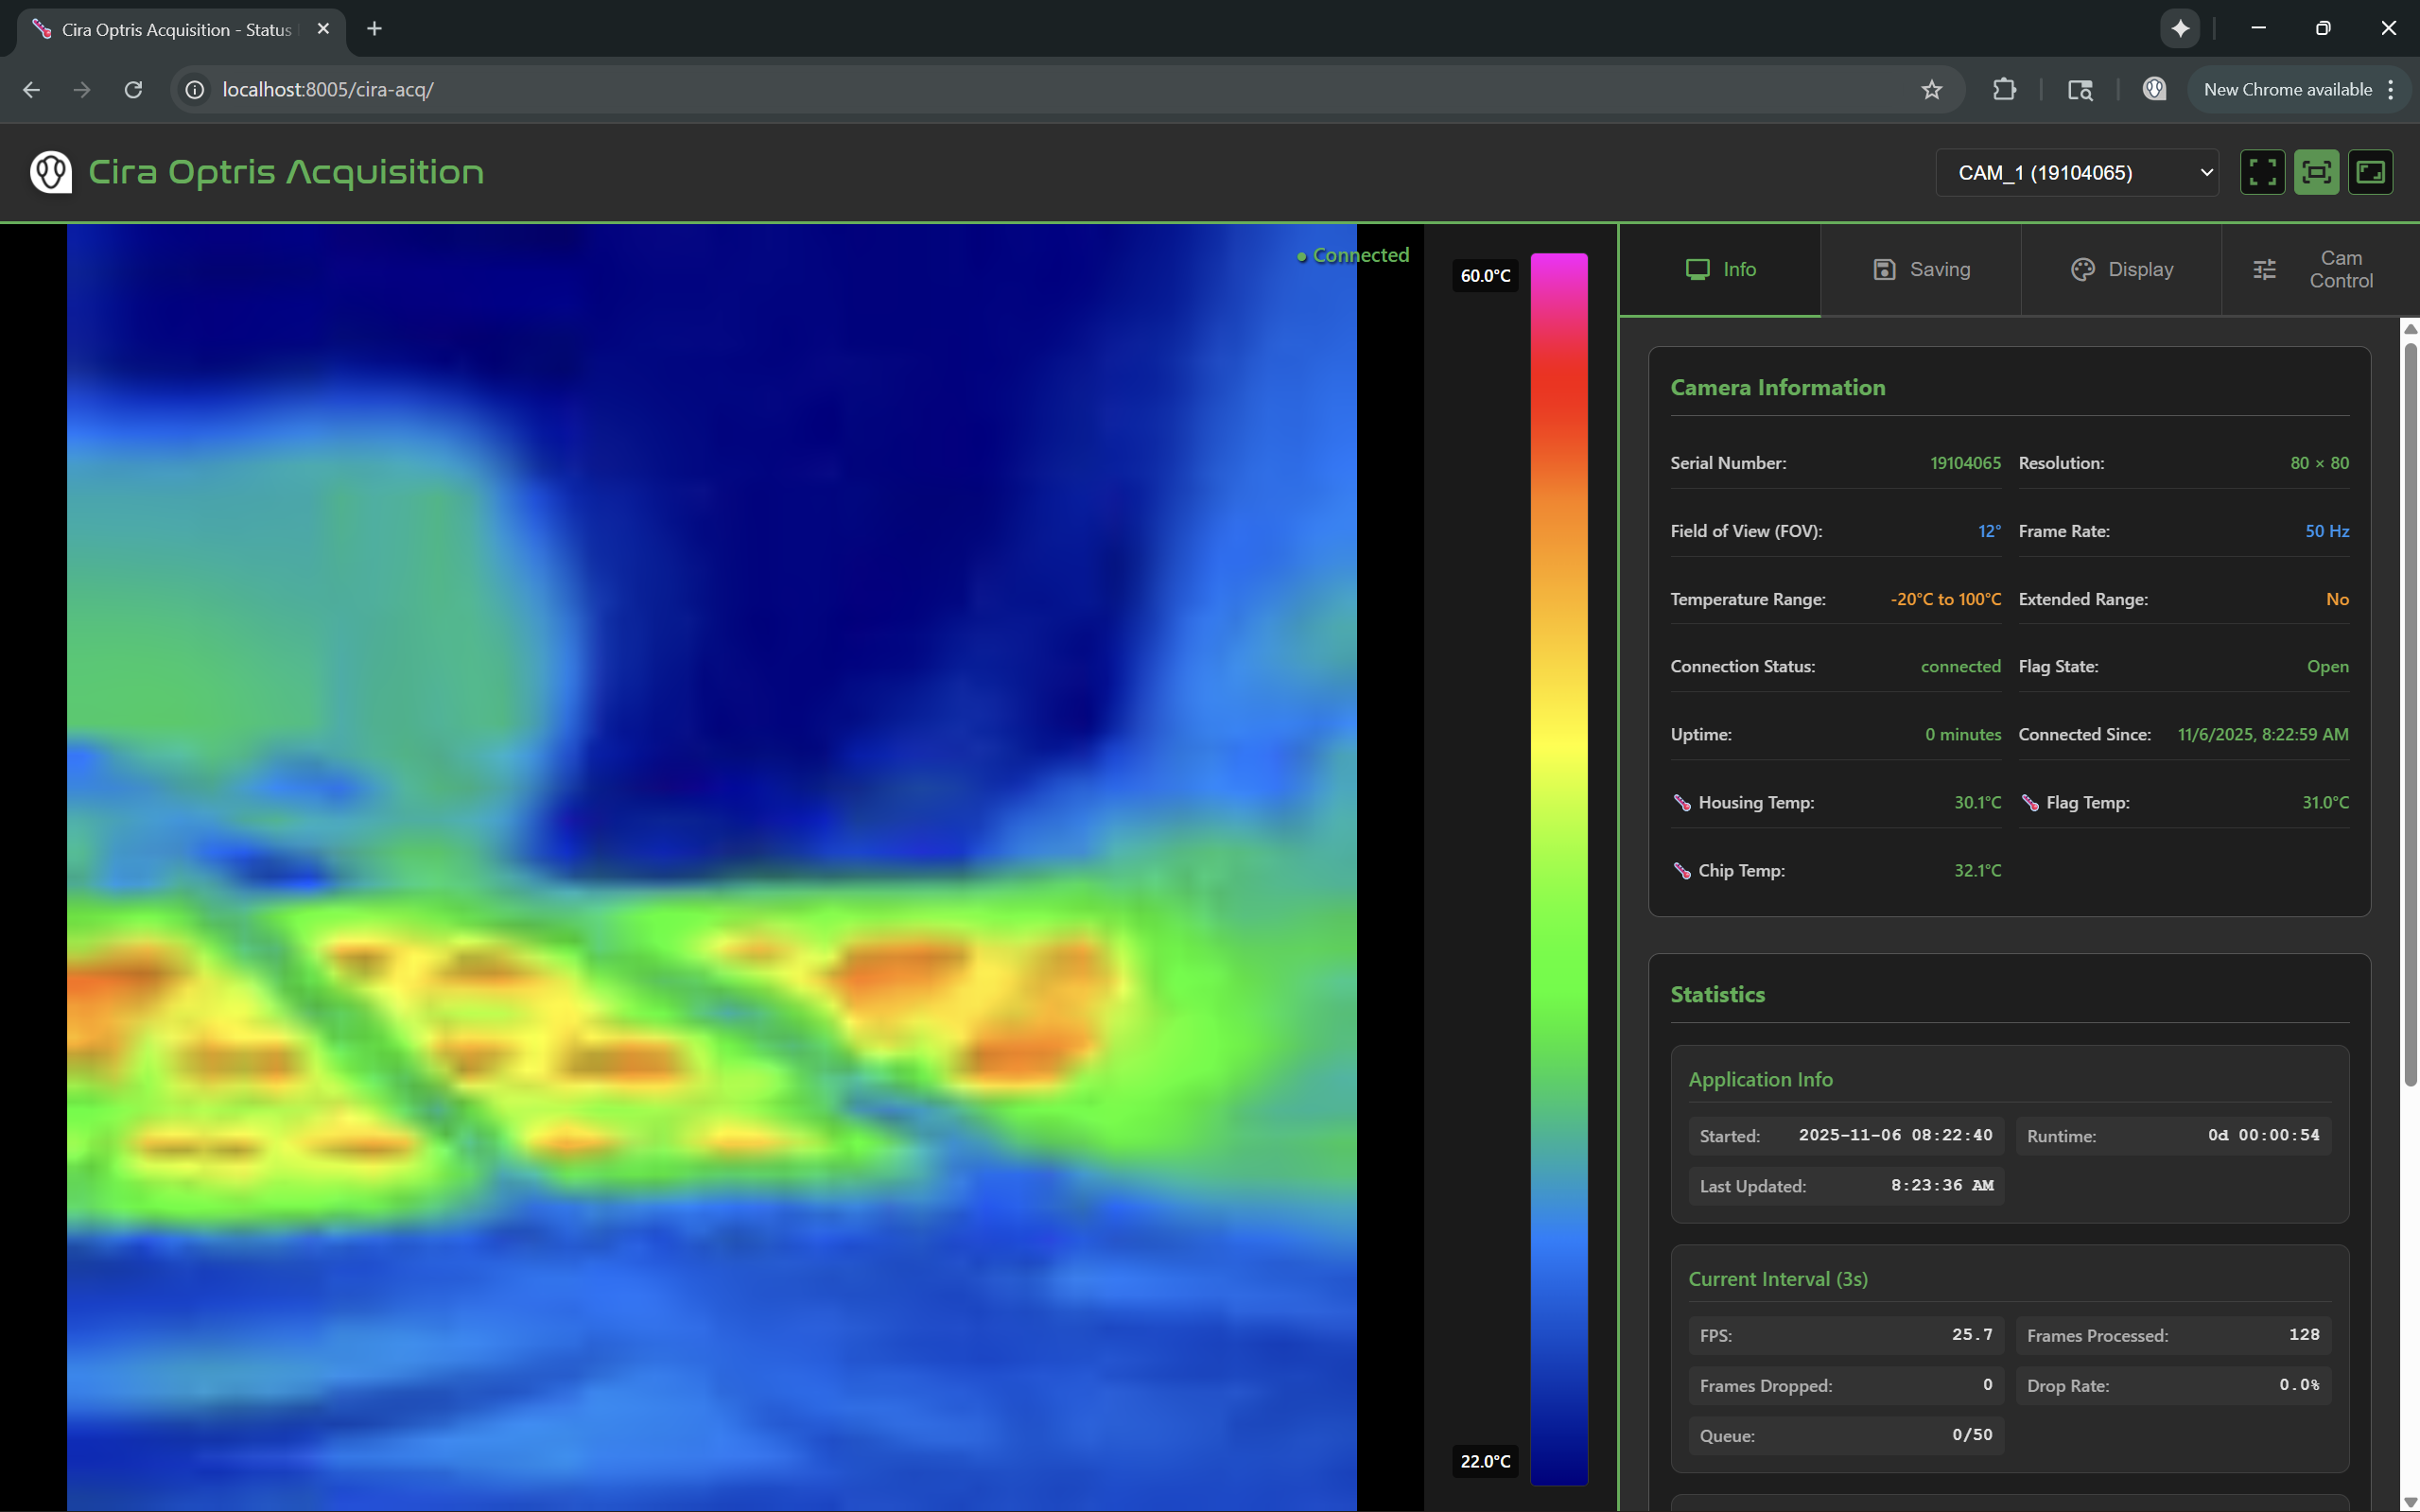
Point the config at your cameras and start the containers. Minutes later the dashboard shows each camera live with its serial number, field of view, temperature range, flag state, housing and chip temperature, frame rate and drop rate.
- Ethernet and USB cameras, including USB cameras behind a GigE USB server, so one PC can serve a whole floor.
- Shared-memory output with atomic writes: any consumer reads a complete frame, never a torn one.
- Recording of radiometric NPZ frames on interval or on demand, with date-based folders and configurable file names.
- Live control of emissivity, transmissivity, ambient temperature, temperature range, focus, autofocus and shutter flag from the web UI or the API.
- Palettes and alarm overlays: iron, rainbow, grayscale and custom, plus above/below temperature zones painted on the stream.
- In-plane rotation for cameras mounted at 90°, 180° or 270°.
- Health as tags: frame min/max/avg, FPS, disconnections and internal temperatures published to the plant bus.
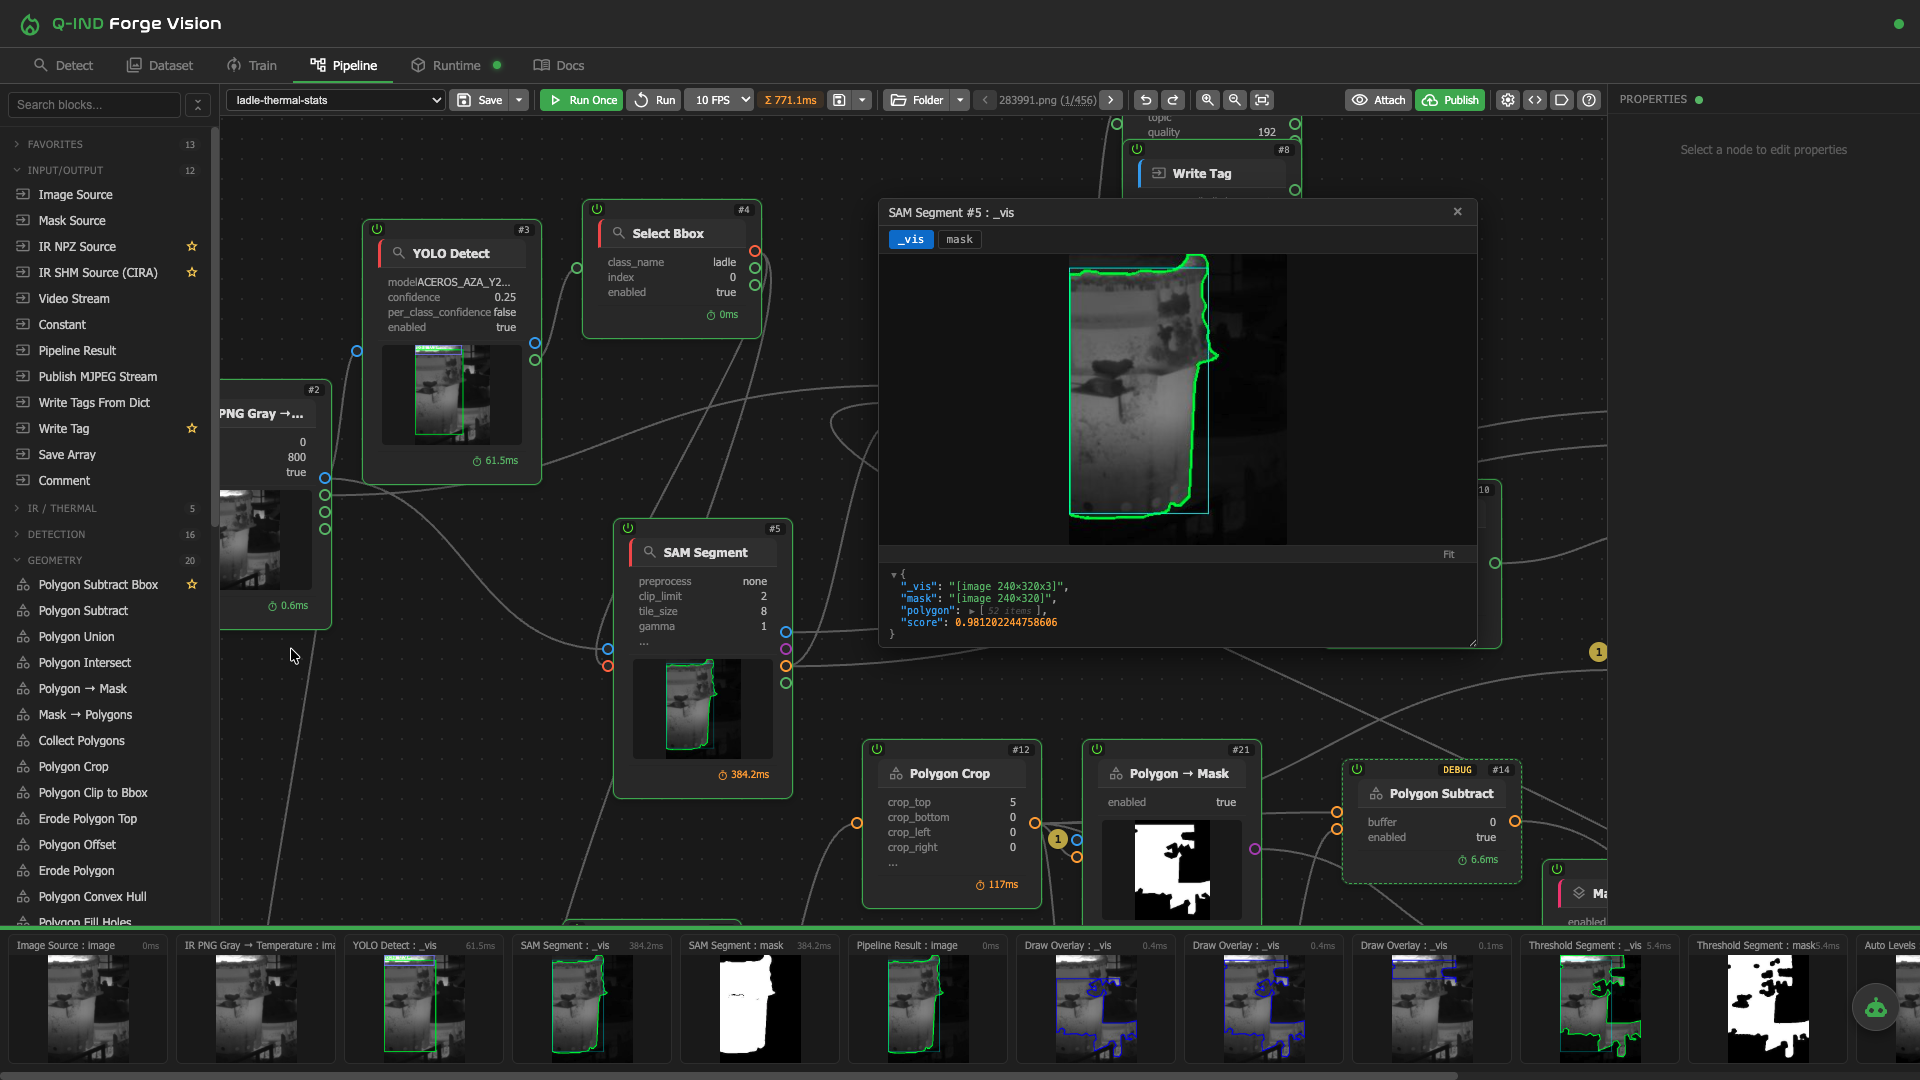
AI that reads degrees, not colors
A drag-and-drop editor where the IR SHM Source block delivers the live float32 matrix from the acquisition. Detect the object, segment it precisely, cut the polygon you care about and compute min, max, average and standard deviation inside it. Then write the numbers to tags.
- Complete workflow: capture datasets, label in-app, train YOLO, validate on the test bench, publish to runtime.
- Plug-and-play models: drop a model folder and the server picks the fastest available format automatically (TensorRT, OpenVINO or PyTorch).
- More than 100 blocks: YOLO, MobileSAM and FastSAM, tracking, OCR, ArUco, morphology, contours, polygon geometry, thermal histograms and palettes, math expressions.
- Runtime triggers from the plant: every N ms, on every new frame, or when a tag expression such as HEAT_ON and LADLE_PRESENT becomes true.
- Augmented video: republish an MJPEG stream with polygons, crosshairs and temperatures burned in, ready for any SCADA screen.
- AI pipeline assistant drafts a pipeline from a sentence; every block ships with inline documentation.
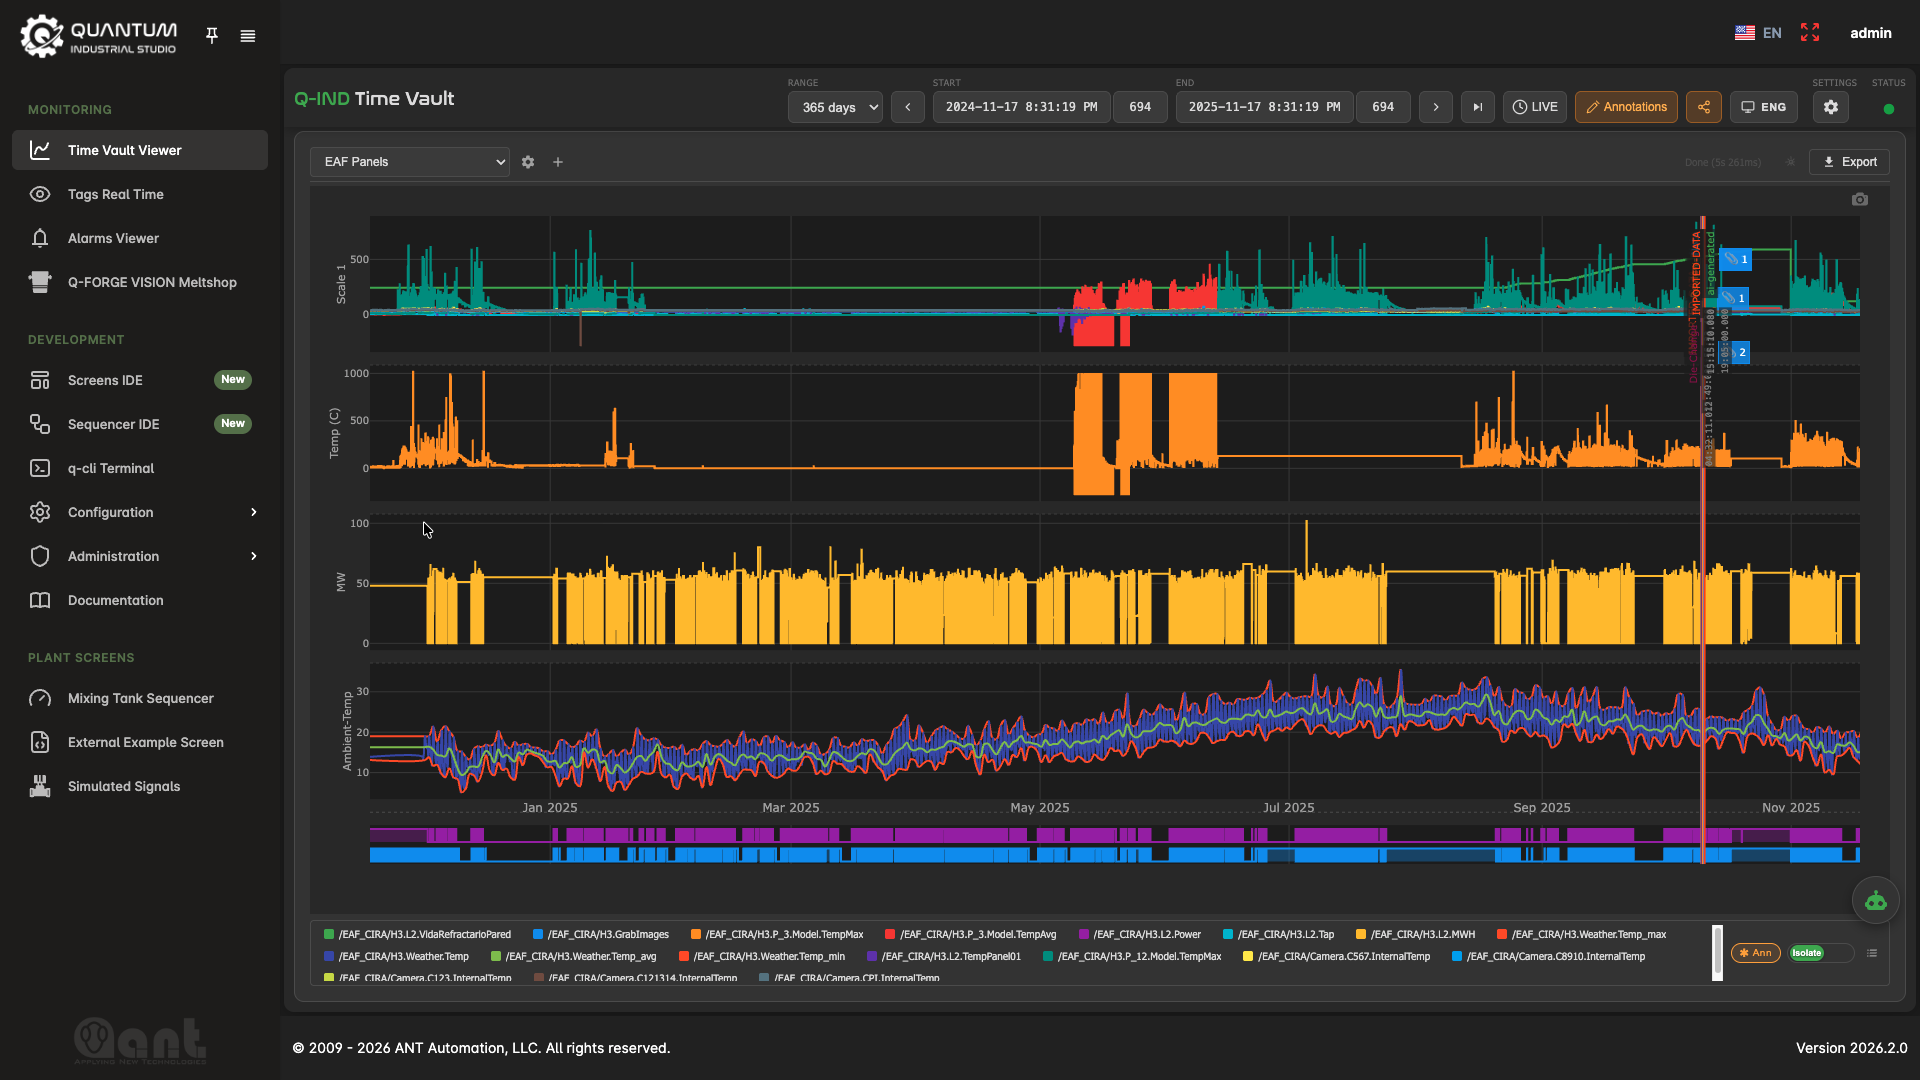
A year of thermal history, opened in seconds
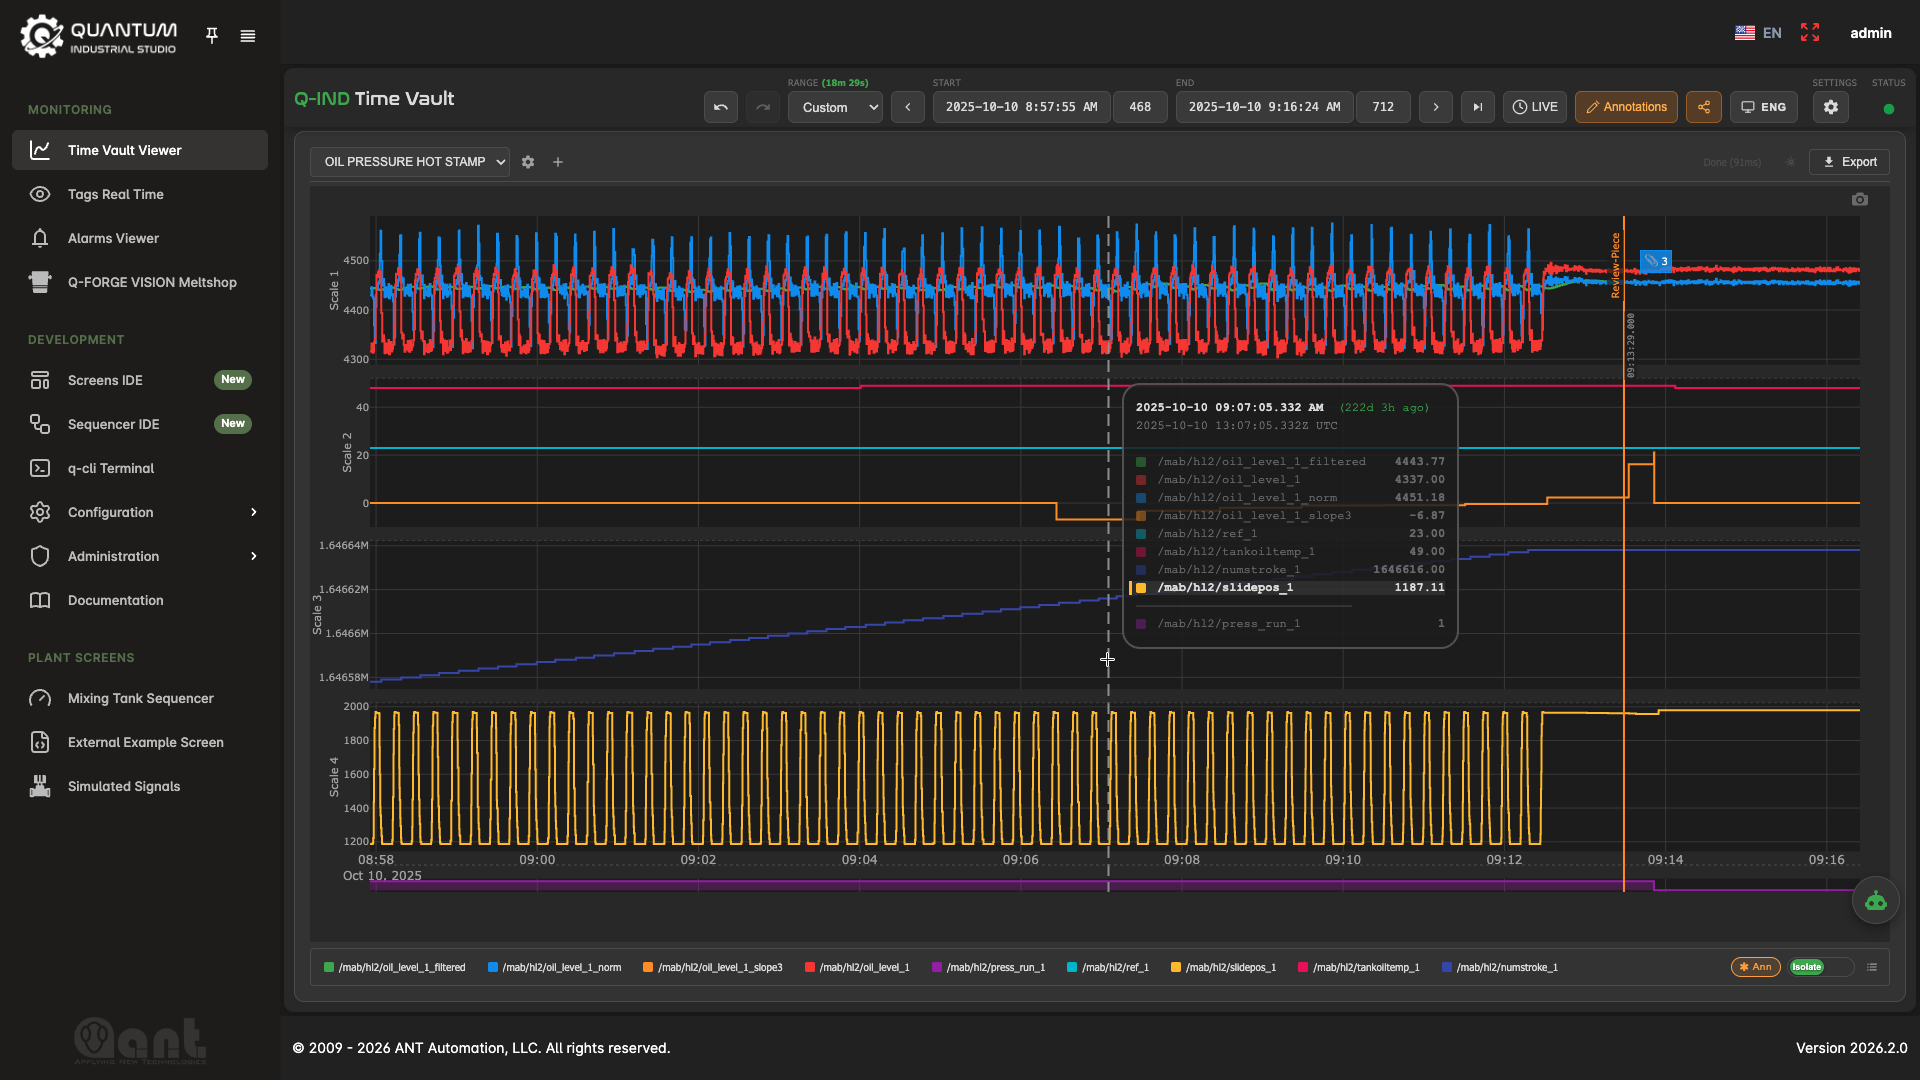
Process signals, camera health and every temperature the pipelines produce land in the vault with millisecond timestamps. The viewer draws a full year of a six-camera EAF in one chart and lets you dive to a single second without changing tools.
- Full resolution forever: no rollups that erase the peak that mattered.
- Shape-preserving downsampling keeps the real timestamp of each min and max, so a two-second spike still shows up in a 30-day view.
- Annotations with images: an alarm posts a note and the augmented thermal snapshot on the trend itself, searchable and navigable event to event.
- Frame replay: recorded radiometric NPZ frames stay linked to the timeline, so you scrub the trend and see the thermography of that instant.
- Deterministic analytics across tags: correlations, expressions, SPC and anomaly detection on live and historical data.
- Export to CSV, batch and zipped multi-tag queries through the REST API.
Where it runs today
Every application below is a Q-Forge Vision pipeline over CIRA acquisition, delivered as a configured product with its own screens, alarms and reports.
Ladle hot-spot detection
Cameras at the ladle furnace and casting turret detect the ladle, read its number, segment slag line, barrel and bottom and watch each zone for hot spots, spills and cold arrivals. Heat history with navigable thermography and per-ladle refractory wear reports.
EAF cooling panels & tap-hole
Continuous surveillance of water-cooled panels and the EBT tap-hole from several cameras. SPC over hundreds of heats separates refractory wear from real panel events and filters slag splashes from true hot spots.
Slag detection on tap stream
Detects slag carry-over on the pour stream as it appears, protecting ladle refractory and downstream metallurgy. Output as a tag for the tapping operator screen.
Torpedo car detection & ID
Detects torpedo cars in the thermal image and reads their number, giving a shell temperature profile per car per trip for refractory monitoring and logistics.
Freeboard measurement
Vision measures freeboard height in the ladle in real time, feeding refractory life, capacity planning and stirring quality.
Die temperature inspection
Measurement points defined per die and per recipe, emissivity and palette per recipe, the active recipe following the PLC. Every piece measured, every cycle recorded against its threshold.
Also built with the same blocks: crane and LMF hot-spot detection, refractory wear baselining, flame and burner state, equipment thermal baselining, conveyor anomalies, scrap truck inspection, zone intrusion and PPE compliance. Ladle and crane hot-spot detection is the subject of an AISTech 2026 paper.
The thermal result becomes a plant tag
Once a temperature is a tag, everything in the platform applies to it: trends, alarms, screens, expressions, sequencers, reports and the AI assistant.
Drivers by web
Siemens S7, Allen-Bradley ControlLogix, Modbus TCP/RTU, OPC UA, IEC 60870-5-104/101, IEC 61850, MTConnect and MQTT bridges. Devices are created and tested from the browser, with built-in S7, Modbus and OPC UA simulators. Plugin architecture for custom drivers.
Screens & 3D twins
Web-based mimics and 3D digital twins with the thermal MJPEG streams embedded as widgets next to live values.
Alarms & notifications
Threshold and rule alarms on thermal tags, acknowledgement with audit trail, email with the thermal snapshot embedded.
AI assistant
A Model Context Protocol server that knows your tags, screens and pipelines. Ask for a trend, a correlation, a new screen or a pipeline in plain language. Each application adds its own tools to the assistant.
Expressions & SPC
Virtual tags computed from formulas between tags, deterministic SPC (I-MR, CUSUM, EWMA, Cp/Cpk) and anomaly detection without thresholds.
Sequencers
Automated sequences and PLC simulation with their own IDE, so a thermal event can drive an action.
Lightweight & offline
Runs on minimal industrial hardware, fully offline, one instance per line or plant, interconnectable.
No per-tag, no per-seat
Unlimited tags, screens, alarms and engineers. Continuous updates.
Docker. One folder. One command.
Everything ships as images on Docker Hub. A plant deployment is a folder with the config, an .env with the ports, and compose. Windows hosts can run the acquisition as a native executable with the web UI and video server in containers.
| Compatibility | |
|---|---|
| Cameras | Optris PI series (PI 160 / 200 / 400 / 450 / 640 / 1M) and Xi series (Xi 80 / 160 / 400 / 410 / 440 / 640 / 1M), as exposed by OTC SDK 10.1. Production-proven with Xi 80, Xi 410 ETH, Xi 640 and PI 1M. |
| Interfaces | USB direct, Ethernet (Xi ETH, PI NetBox), USB over GigE USB server (W&T) |
| Host OS | Linux x86-64 (Docker), Windows 10/11 x86-64 (native acquisition + Docker), ARM64 and NVIDIA Jetson for Q-Forge Vision |
| Calibration | Optris calibration files from PIX Connect, mounted into the container |
| Data formats | float32 temperature matrix (SHM, NPZ), MJPEG, MQTT JSON tags, CSV export |
| Integration | REST APIs with Swagger on every service, MQTT, WebSocket, OPC-quality tags, Python client library |
| Security | Single sign-on across services, JWT API tokens, user roles, audit log |
| Languages | UI in English and Spanish, others on request |
Ladle hot-spot detection, in two minutes
Documents
The four products, the applications and the platform on a few pages.
Camera setup, installation, configuration reference, recording, streaming, first AI pipeline, REST API.
Version history of CIRA Optris Acquisition, Q-Forge Vision, Q-IND Time Vault and QUANTUM Industrial Studio.
Pilot first. Then it is yours.
We sell directly to plants, worldwide, and deliver remotely. No integrators in between.
1 · Pilot
One camera, three months, fixed price. You mount the camera following the manual and send us a day of recordings. We train the model, commission the pipeline and the screens remotely, and you watch it run on your process. Credited toward the project.
2 · Application
Ladle hot spots, EAF panels, tap-hole, slag, torpedo cars, freeboard or die inspection, delivered as a configured product with acceptance in the plant: screens, alarms, reports, integration with your PLC and Level 2.
3 · Yours
After the project the plant owns the platform. Unlimited users, tags, screens, alarms and history. Your engineers edit the pipelines and retrain the models with the same tools we used. No per-tag, no per-seat, no lock-in.
Tell us about your cameras and your process
One call to agree the scope of the pilot. From a single camera on a ladle furnace to a plant-wide thermal monitoring system. Software developed and supported by ANT Automation.
- Company
- ANT Automation, LLC
- Address
- 651 Holiday Dr STE 400
Pittsburgh, PA 15220, USA - Web
- ant-automation.com
- Product
- Q-Forge Vision page
- info@ant-automation.com