Follow every piece through the plant. One record, from the first station to the shipped bundle.
Identity and genealogy, a process log per piece, quality results bound to the piece, the live position on the line, reports by shift and crew, and an AI assistant that answers from the same database. Tailored to your line: your stations, your PLCs, your legacy systems, your way of operating. Shown here on a tube mill; the same model tracks coils, slabs, ladles, bundles, castings or parts.
Pipe tracking on an ERW tube mill: weld mill → quench & temper → finishing. Three minutes, one record per pipe.
Q-IND Trace, pipe mill edition · @ANTAutomation
Everything a piece goes through lands on its record. Operators, quality and management look at the same data.
Every piece gets an ID and a lineage: heat → coil → pipe → bundle, splits and merges included. Ask in both directions.
Each station appends what it did: timestamps, setpoints, measured values, operator and crew. The whole life of a piece on one screen.
Pyrometry, ultrasonic and eddy-current tests, hydrotest, vision checks and manual dispositions, with holds and releases: who, when, why.
Today, a single shift, or any date range across a full year of history. Filters and colour-coded status in one click.
Production and rejects by shift, crew, day, week, month or year, with a live reject Pareto. Every column drills down to a single shift.
An animated schematic shows every piece where it is now, fed by the line's sensors and cameras. Line tables per station, always in sync.
Quality does not end at the last station. A customer reject on a finished piece is recorded where and why, so the history stays complete to the last claim.
Plain-language questions answered straight from the plant database: line status, holds, reject causes, even a diagnosis of the selected piece.
The pipe mill edition, screen by screen. Simulated data, real screens.
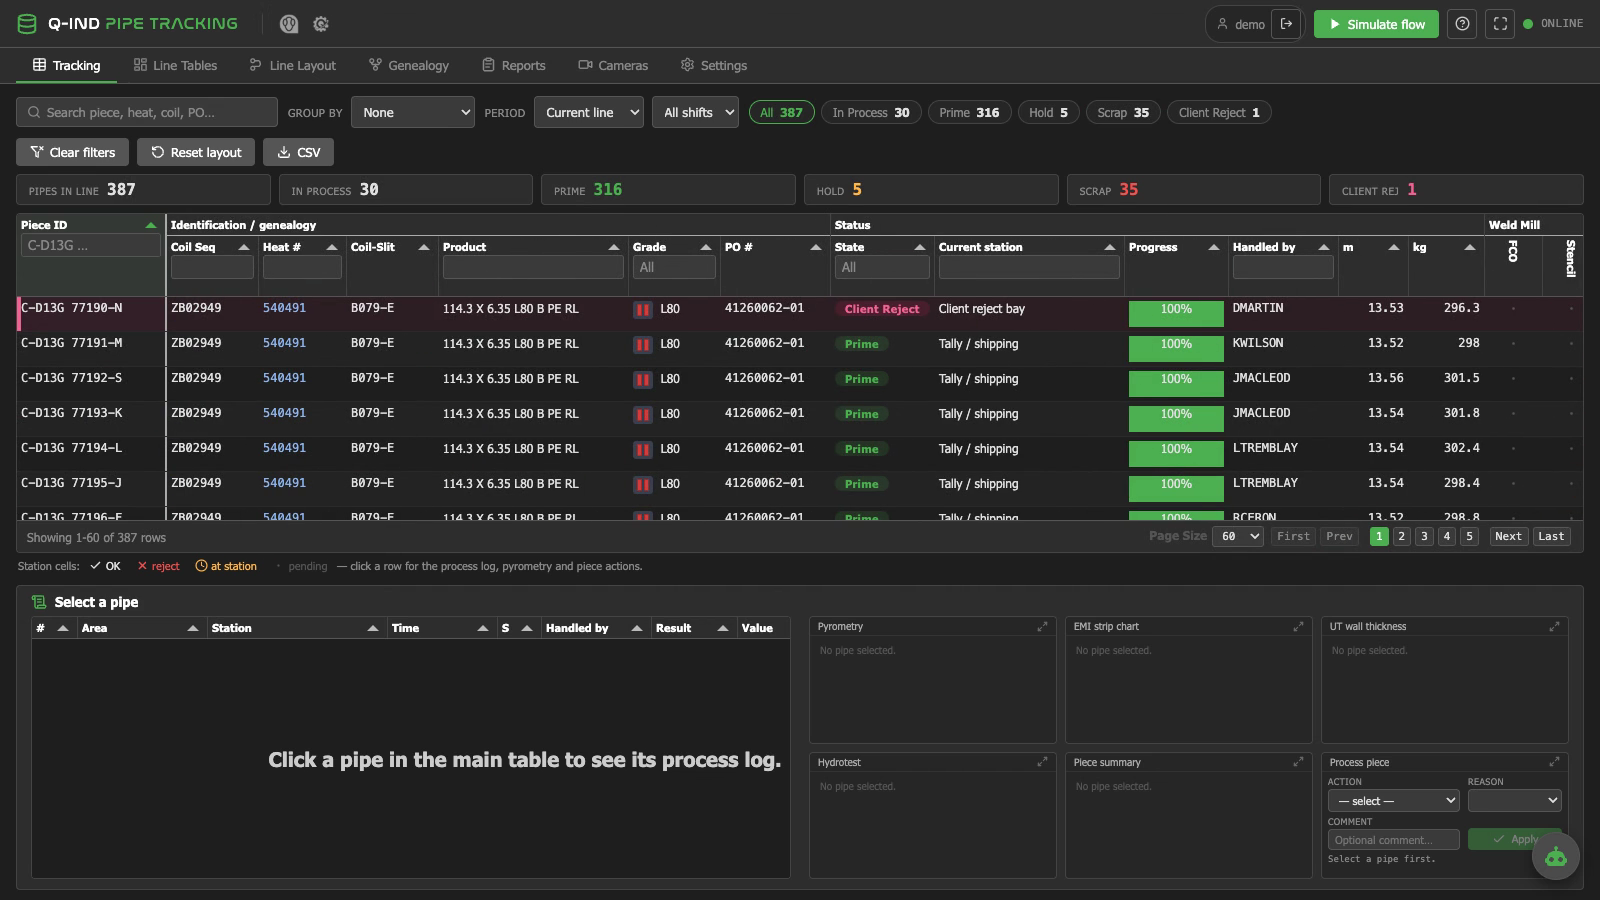
Every pipe is identified the moment it enters the line and followed station by station. One-click status filters and colour-coded rows put holds and rejects in front of the crew instantly.
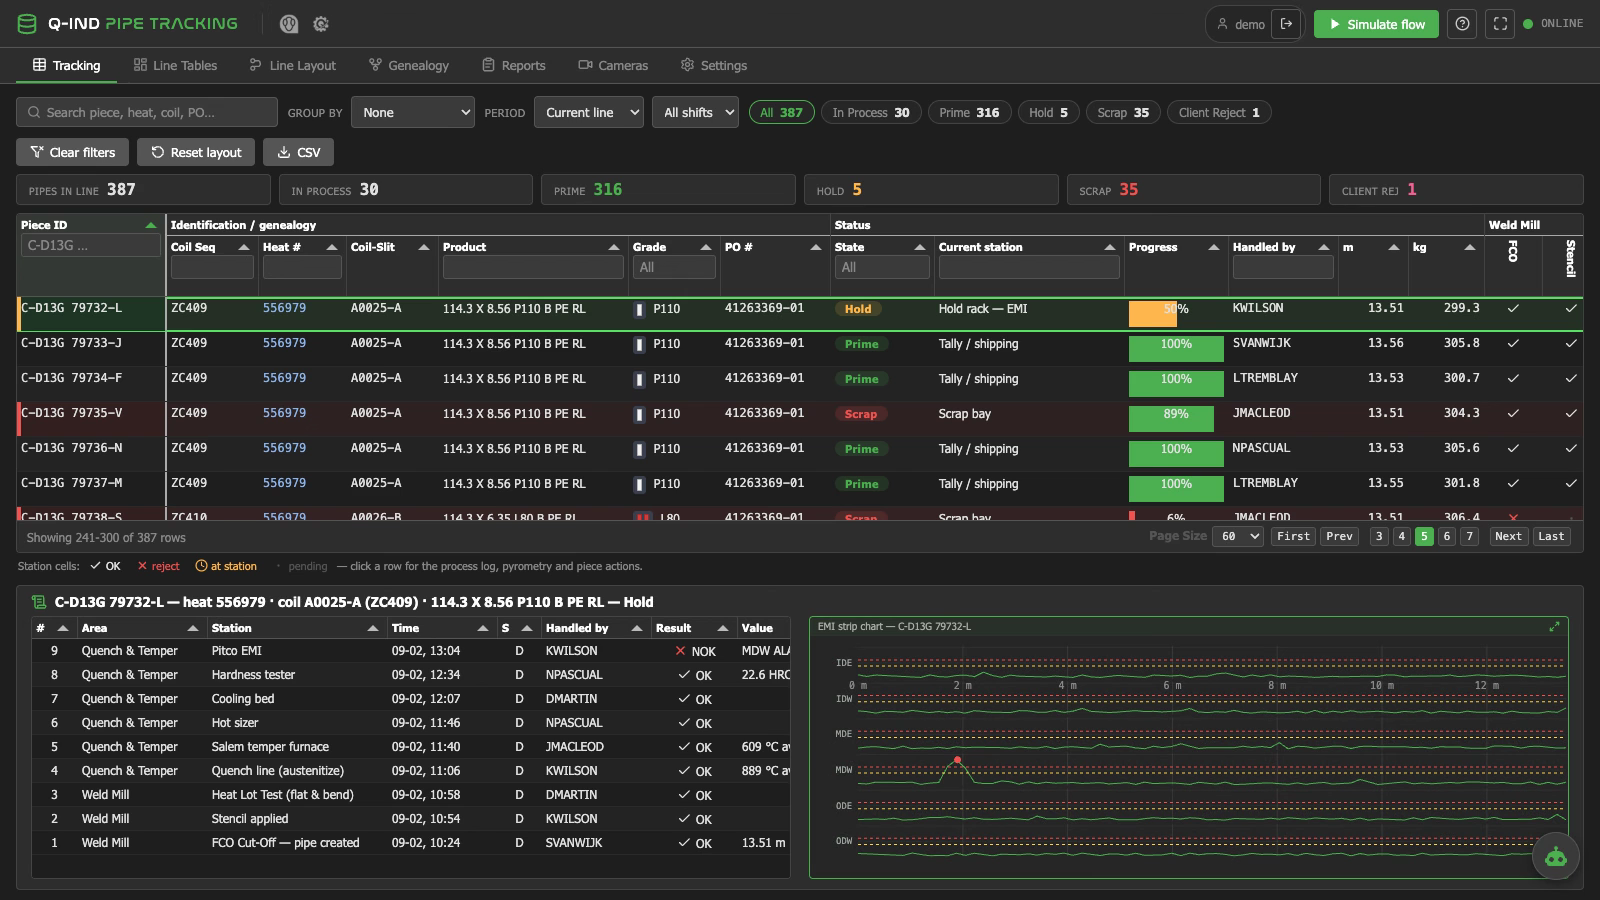
One click opens the full record: process log, pyrometry, EMI, wall thickness and hydrotest. Here the strip chart pinpoints a mid-wall defect at 1.9 metres.
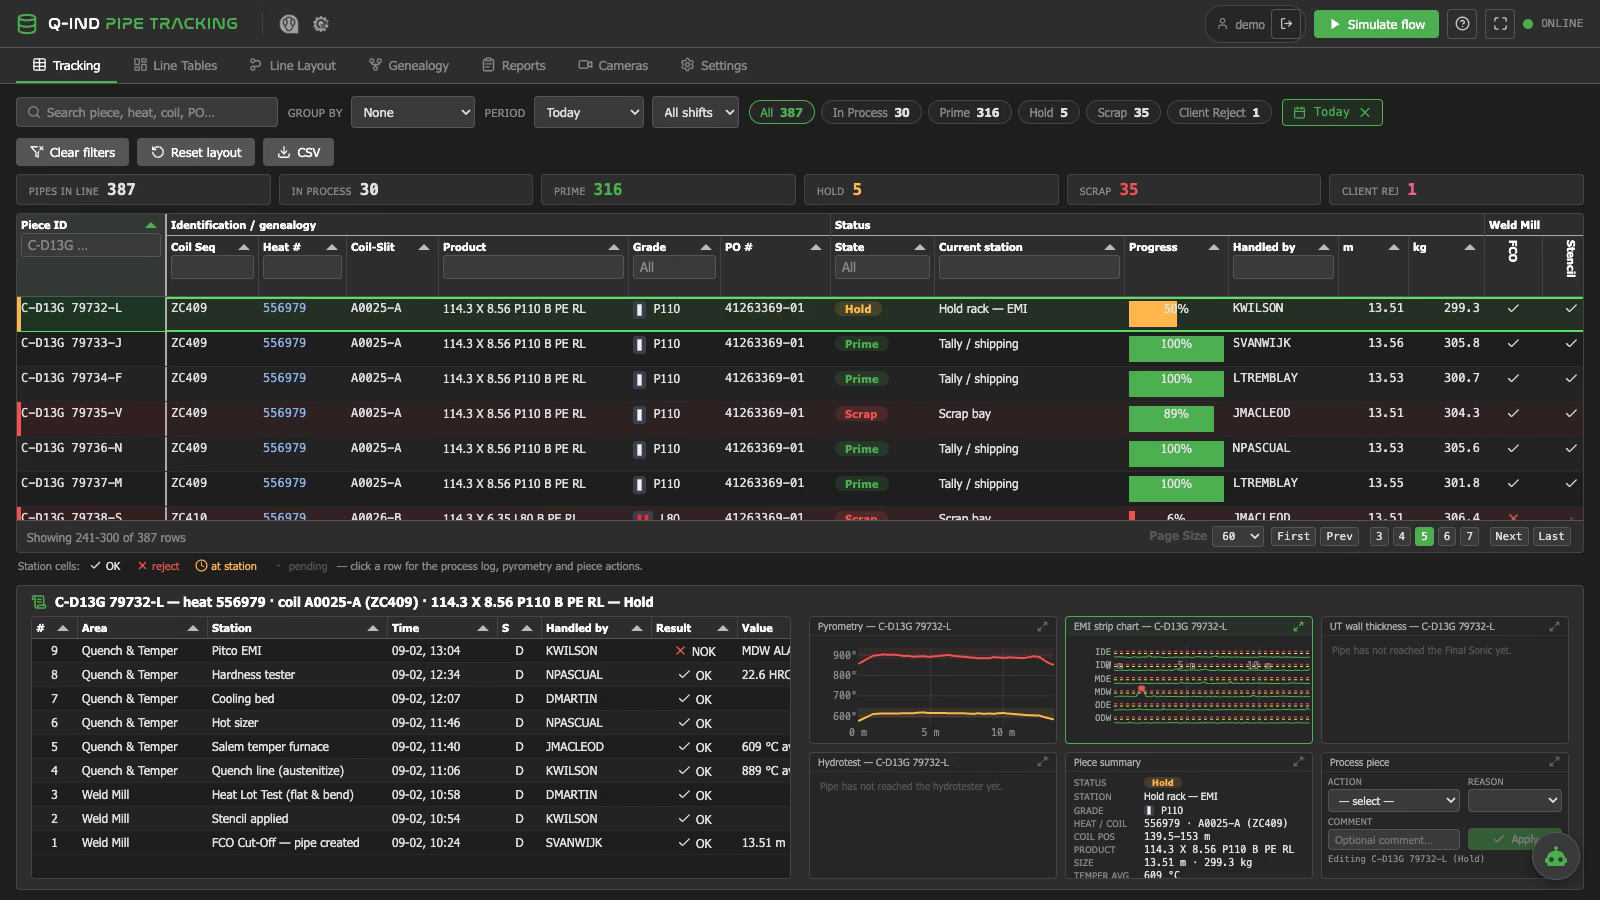
Filter the board to today, a single shift, or any date range across a full year of history. Counters update with the window.
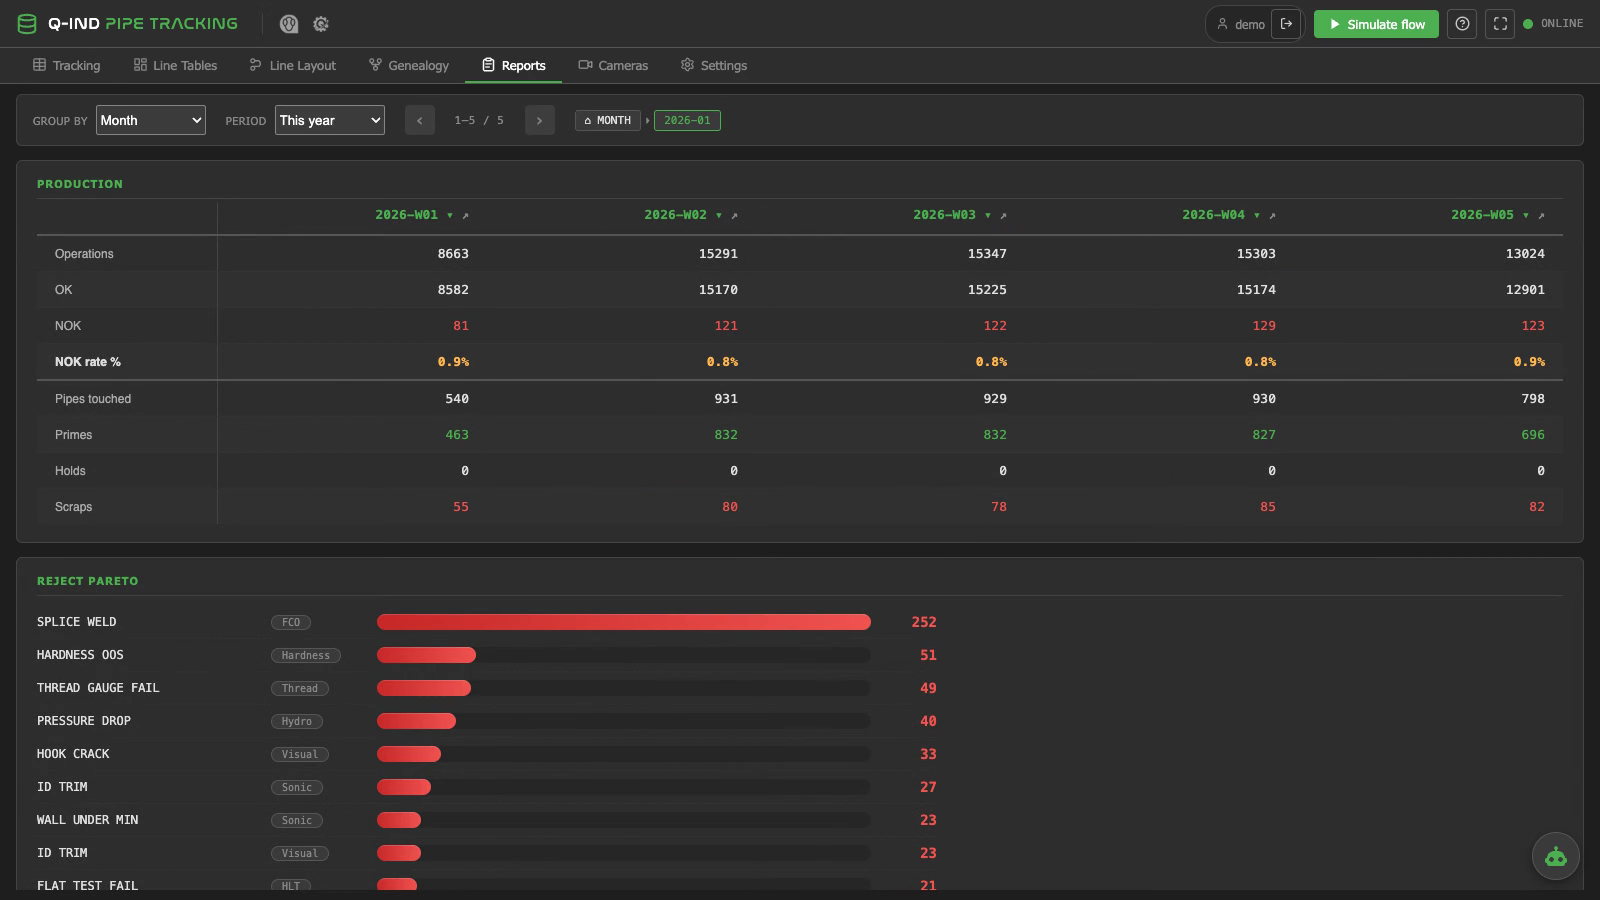
Reports by shift, crew, day, week, month or year. Every column drills down, from the year to a single shift, with a live reject Pareto by cause.
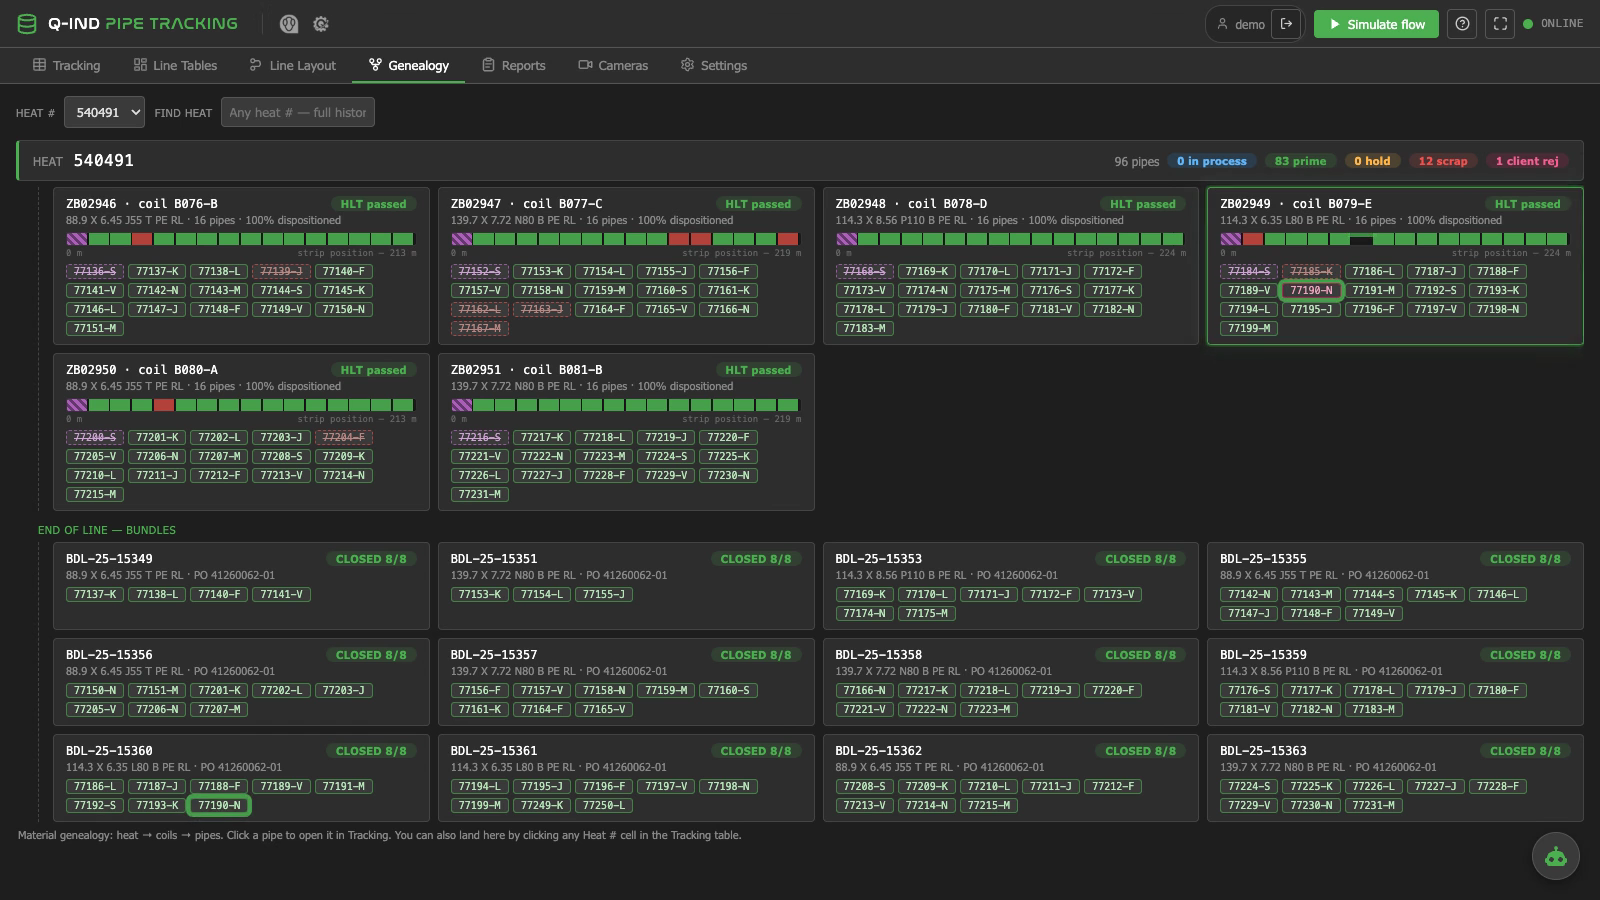
Full genealogy: heat, to coils, to pipes, to bundles, including splice welds and the exact metres of strip behind every pipe.
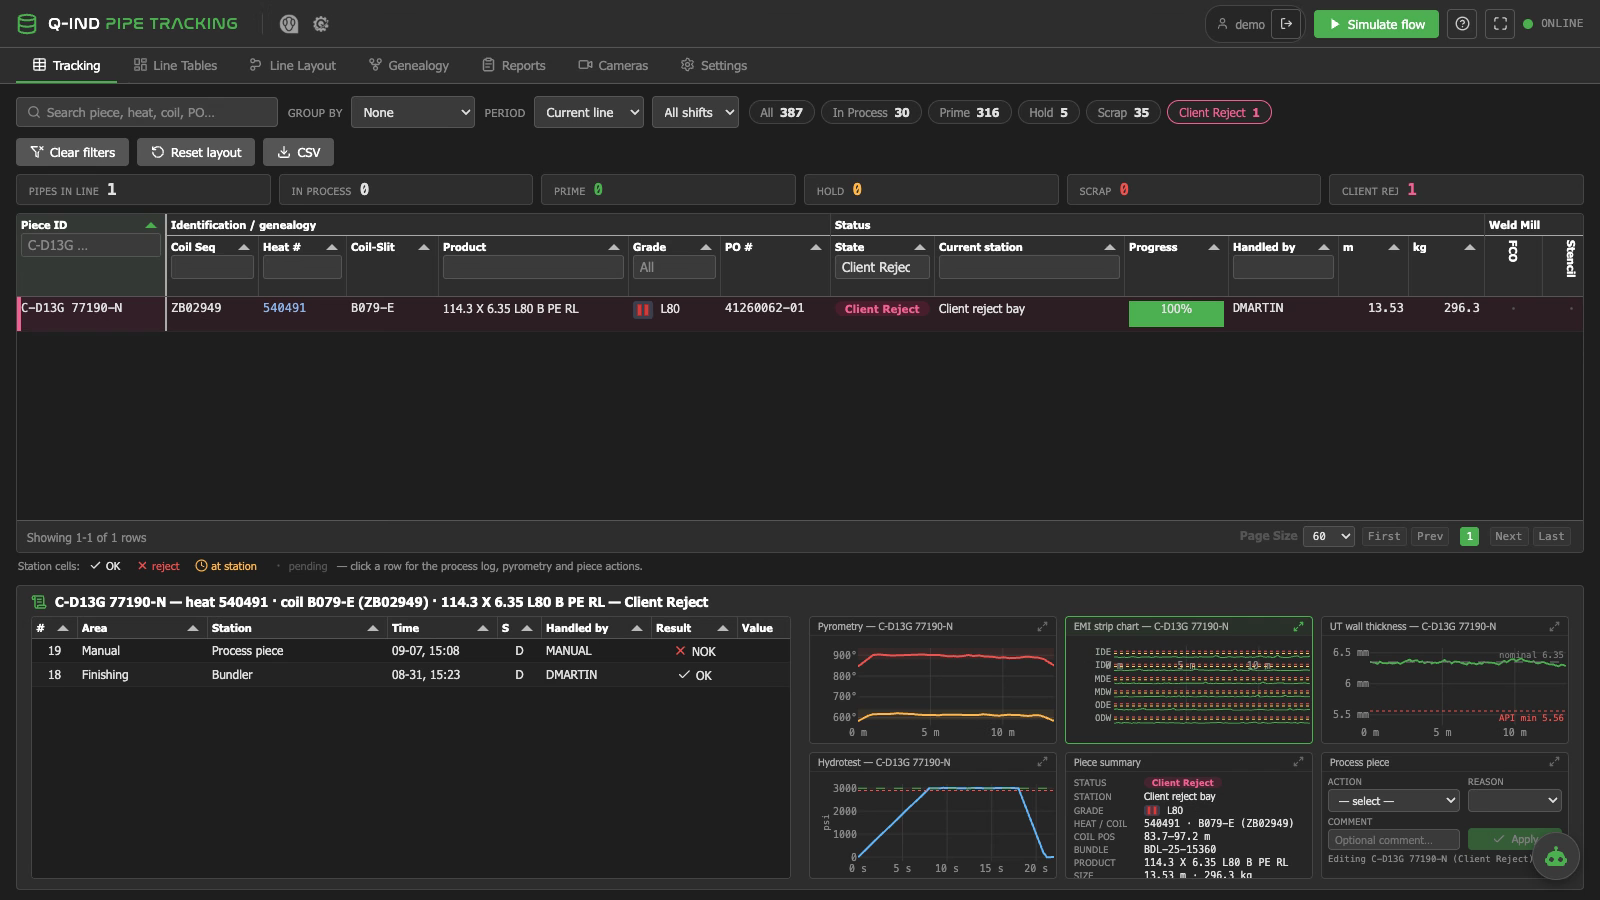
When a visiting customer rejects a finished pipe, one click records it, where it happened and why, so the history stays complete down to the last claim.
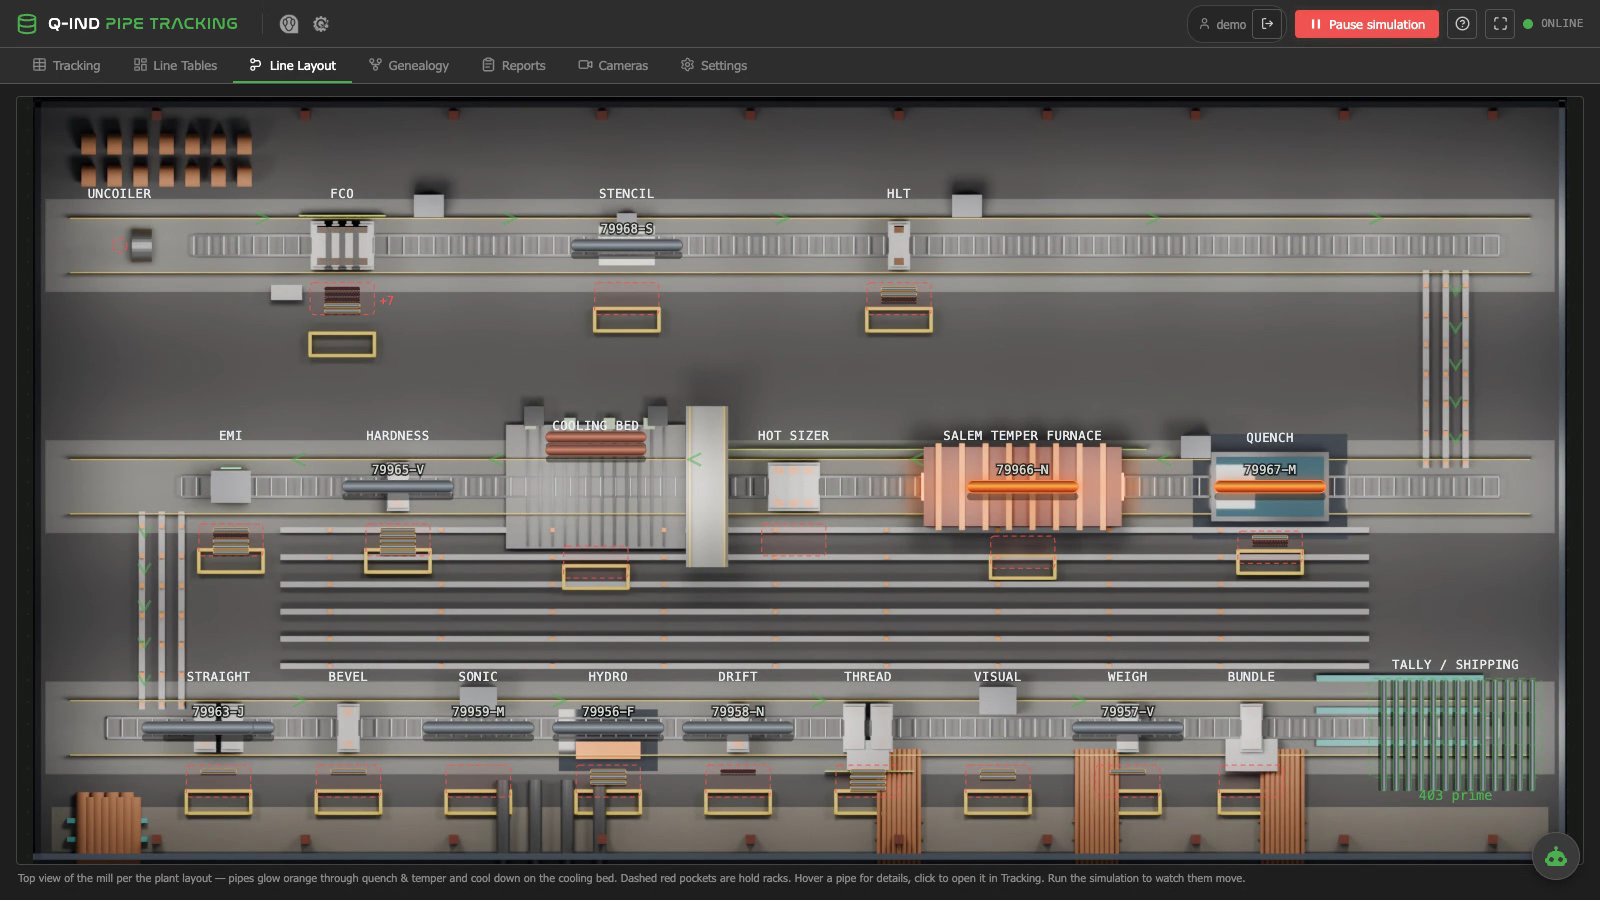
Tracking runs on the line's own sensors, presence detectors, laser barriers, encoders and limit switches, acquired straight from the PLCs. Where sensors cannot reach, Q-Forge Vision cameras validate the tracking.
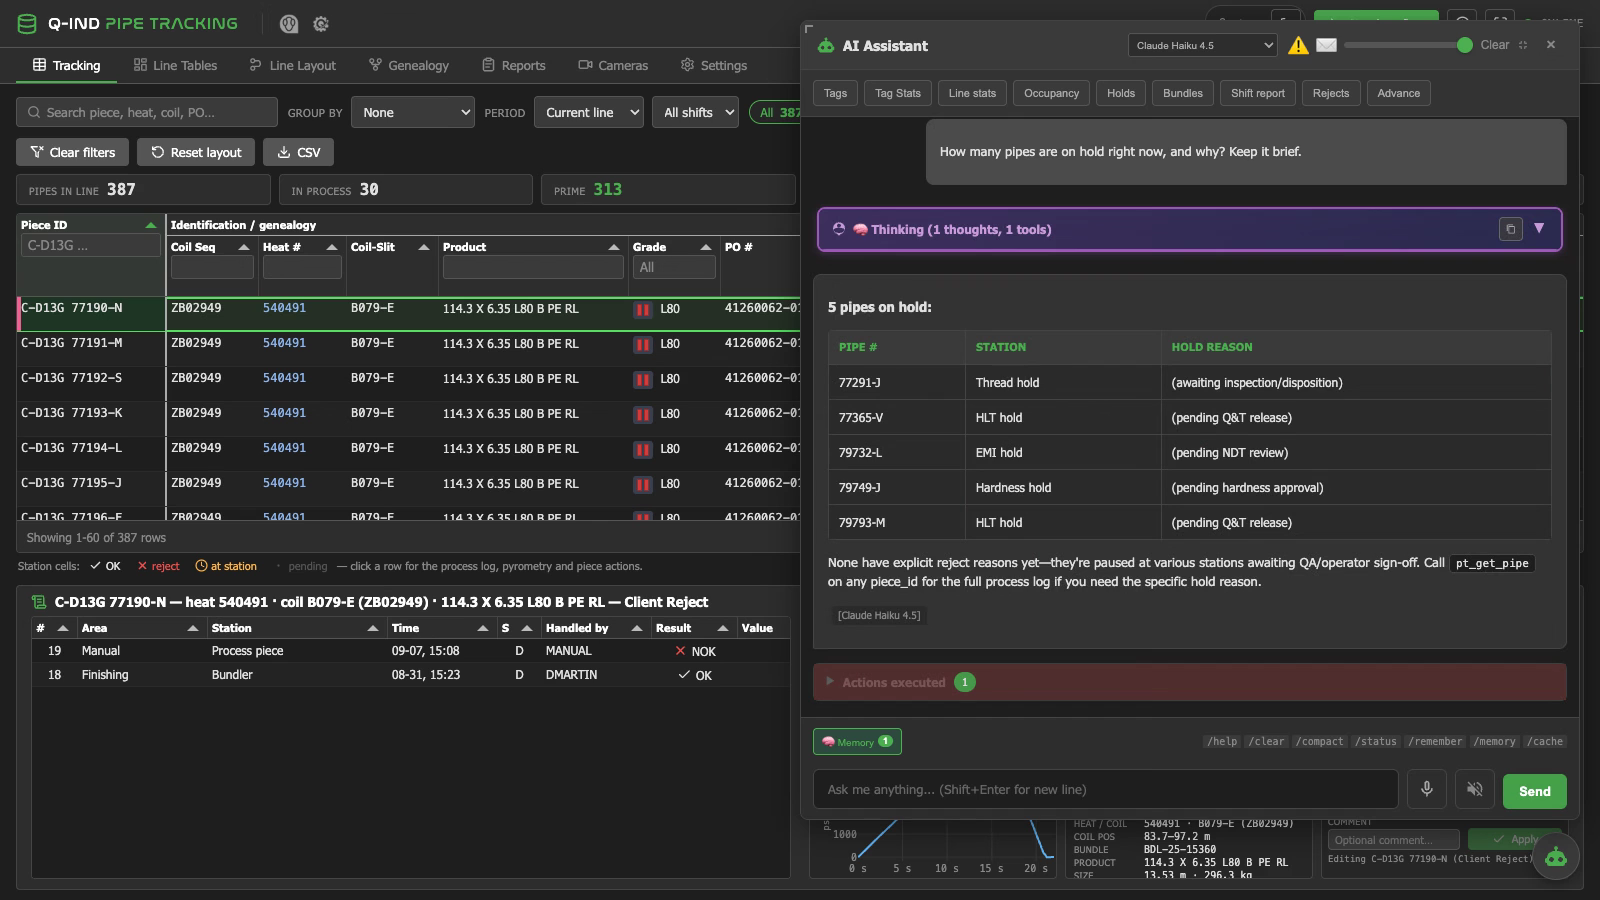
"How many pipes are on hold right now, and why?" The assistant reads the same database through its tools and answers with the record behind it.
If it has an identity and moves through stations, Q-IND Trace can track it. The pipe mill is the edition shown above; the model is generic.
ERW and seamless: weld mill, heat treatment, NDT, hydrotest, finishing, bundling. Genealogy to the heat and the strip metres.
Ladle number, heat number, station times and thermal events from CIRA cameras on the same record.
Piece identity through reheating, rolling, cooling and finishing, with process signals from the Time Vault linked by time.
Close bundles, assign to orders, ship. The customer receives the record, not a folder of certificates.
Pouring, cooling, heat treatment and inspection results per casting, with the mold and the heat behind it.
Serial numbers through stations and tests. Rework loops, holds and releases on the record.
Tailored to your line, on the standard platform. Not a closed box.
Tracking events come from your PLCs, Level 2 and legacy systems through QUANTUM acquisition drivers: S7, ControlLogix, Modbus, OPC UA, IEC and MQTT, configured from the browser.
Each piece is a record in PostgreSQL with its genealogy, stations, tests and dispositions. Everything on screen, in the reports and in the assistant reads the same tables.
Process signals are historized at full resolution in the Time Vault and linked to the piece by time. A year of data, zoomed to ten minutes in a couple of gestures.
Q-Forge Vision pipelines detect, identify and time pieces on camera and write the result as tracking events; CIRA infrared watches the hot end.
The tracking screens are QUANTUM screens: same widgets, same alarms, same users and roles. Reports export to Excel and CSV.
Web app, API with Swagger, database and assistant bundle run as containers on a plant server. Fully offline if needed. No per-tag, no per-seat licensing.
Start with a Base System on one line, delivered remotely and in production from day one, then grow it station by station. Tell us about your line and we will scope it with you.