AI predictive maintenance — configurable in minutes, explainable by design.
Map your assets, point at the MQTT tags you already have, and let Q-PdM watch for the failure patterns hidden in your signals. Nine complementary detection methods, declarative analysis pipelines, peer-to-peer comparison, offline replay and full maintenance lifecycle — without ML PhDs and without per-asset license fees.
A full predictive maintenance stack — asset health, anomaly detection, root-cause hints, maintenance workflow and offline replay — wired straight into the same MQTT signals your plant already publishes.
Per-asset score with Healthy / Warning / Degrading / Critical levels and explainable contributors.
Z-score, slope, EWMA, CUSUM, volatility, time-at-threshold, activeTooLong, stuckState, transition frequency.
Compare each asset against its group — relative ratio, peer z-score, rank, deviation score.
No-code analysis pipelines: rolling stats, filters, gates, correlations, conditional sampling.
Map each evaluation rule to a named failure mode for actionable diagnostics.
Re-evaluate historical data from CSV, QUANTUM historian or direct data API to validate tuning.
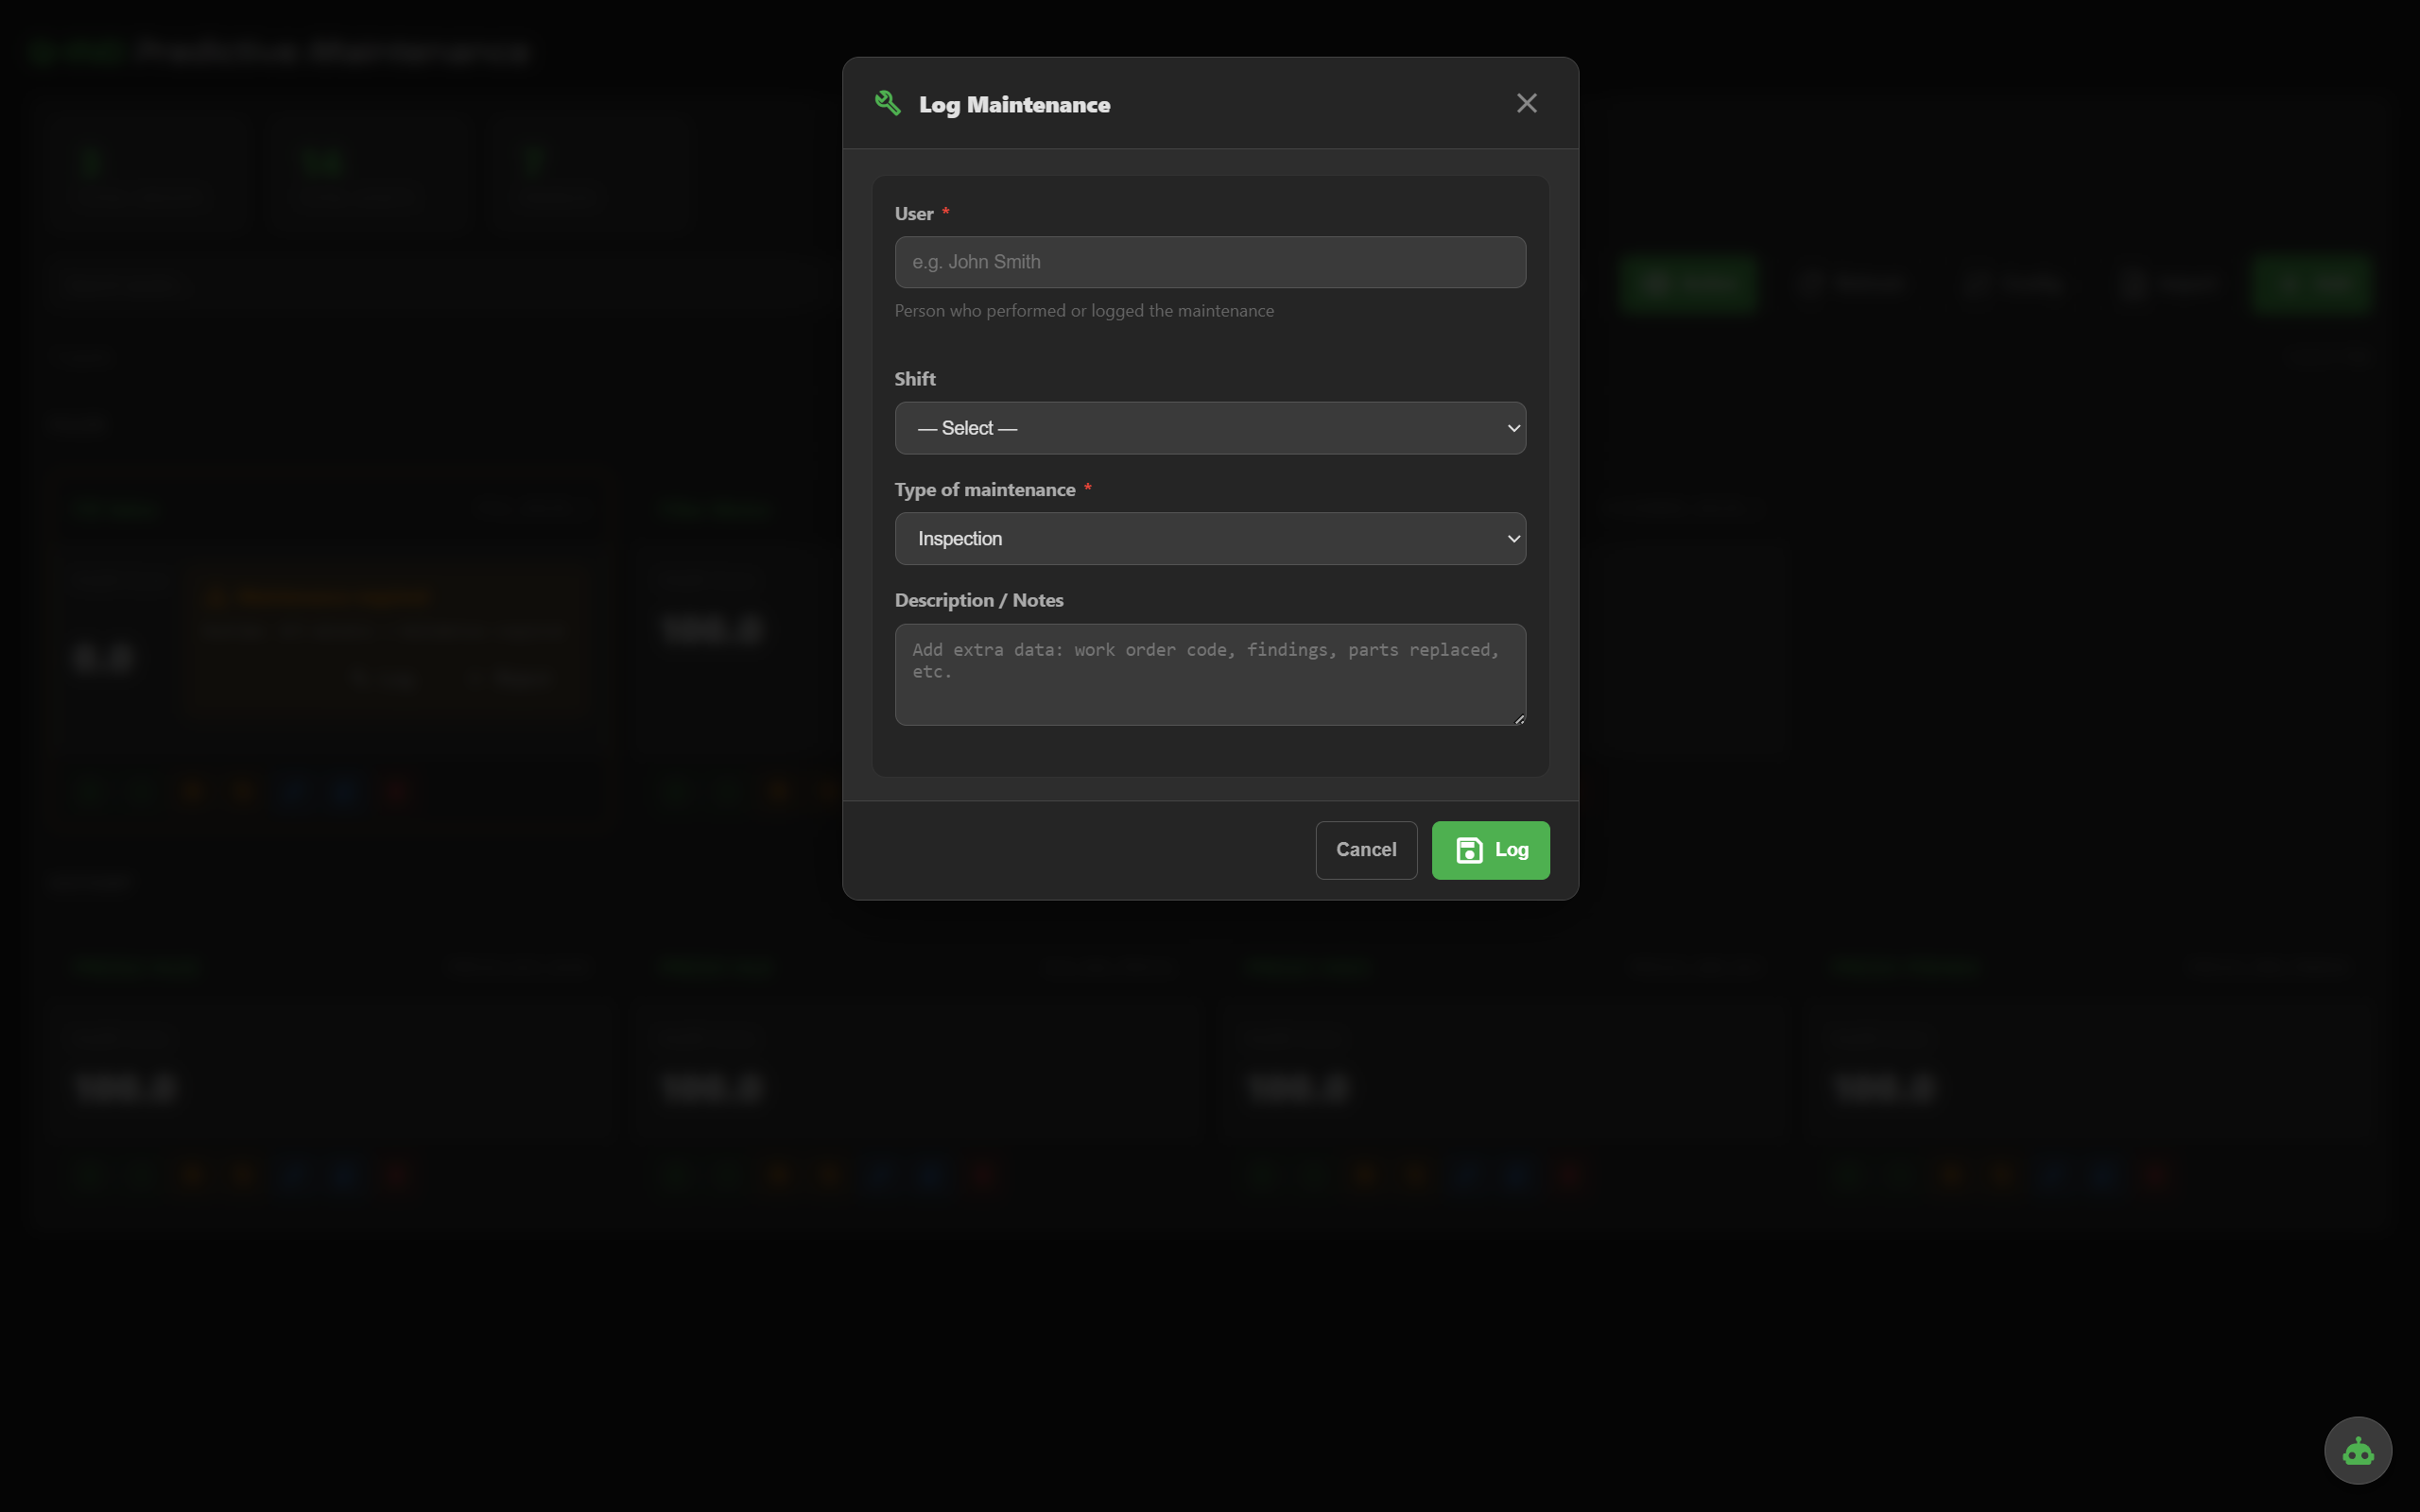
Log maintenance, reset accumulators, full history per asset, manual or tag-triggered.
Recommends thresholds, windows and weights based on historical behavior of your assets.
Computed outputs published back to MQTT; anomaly events posted as annotations on charts.
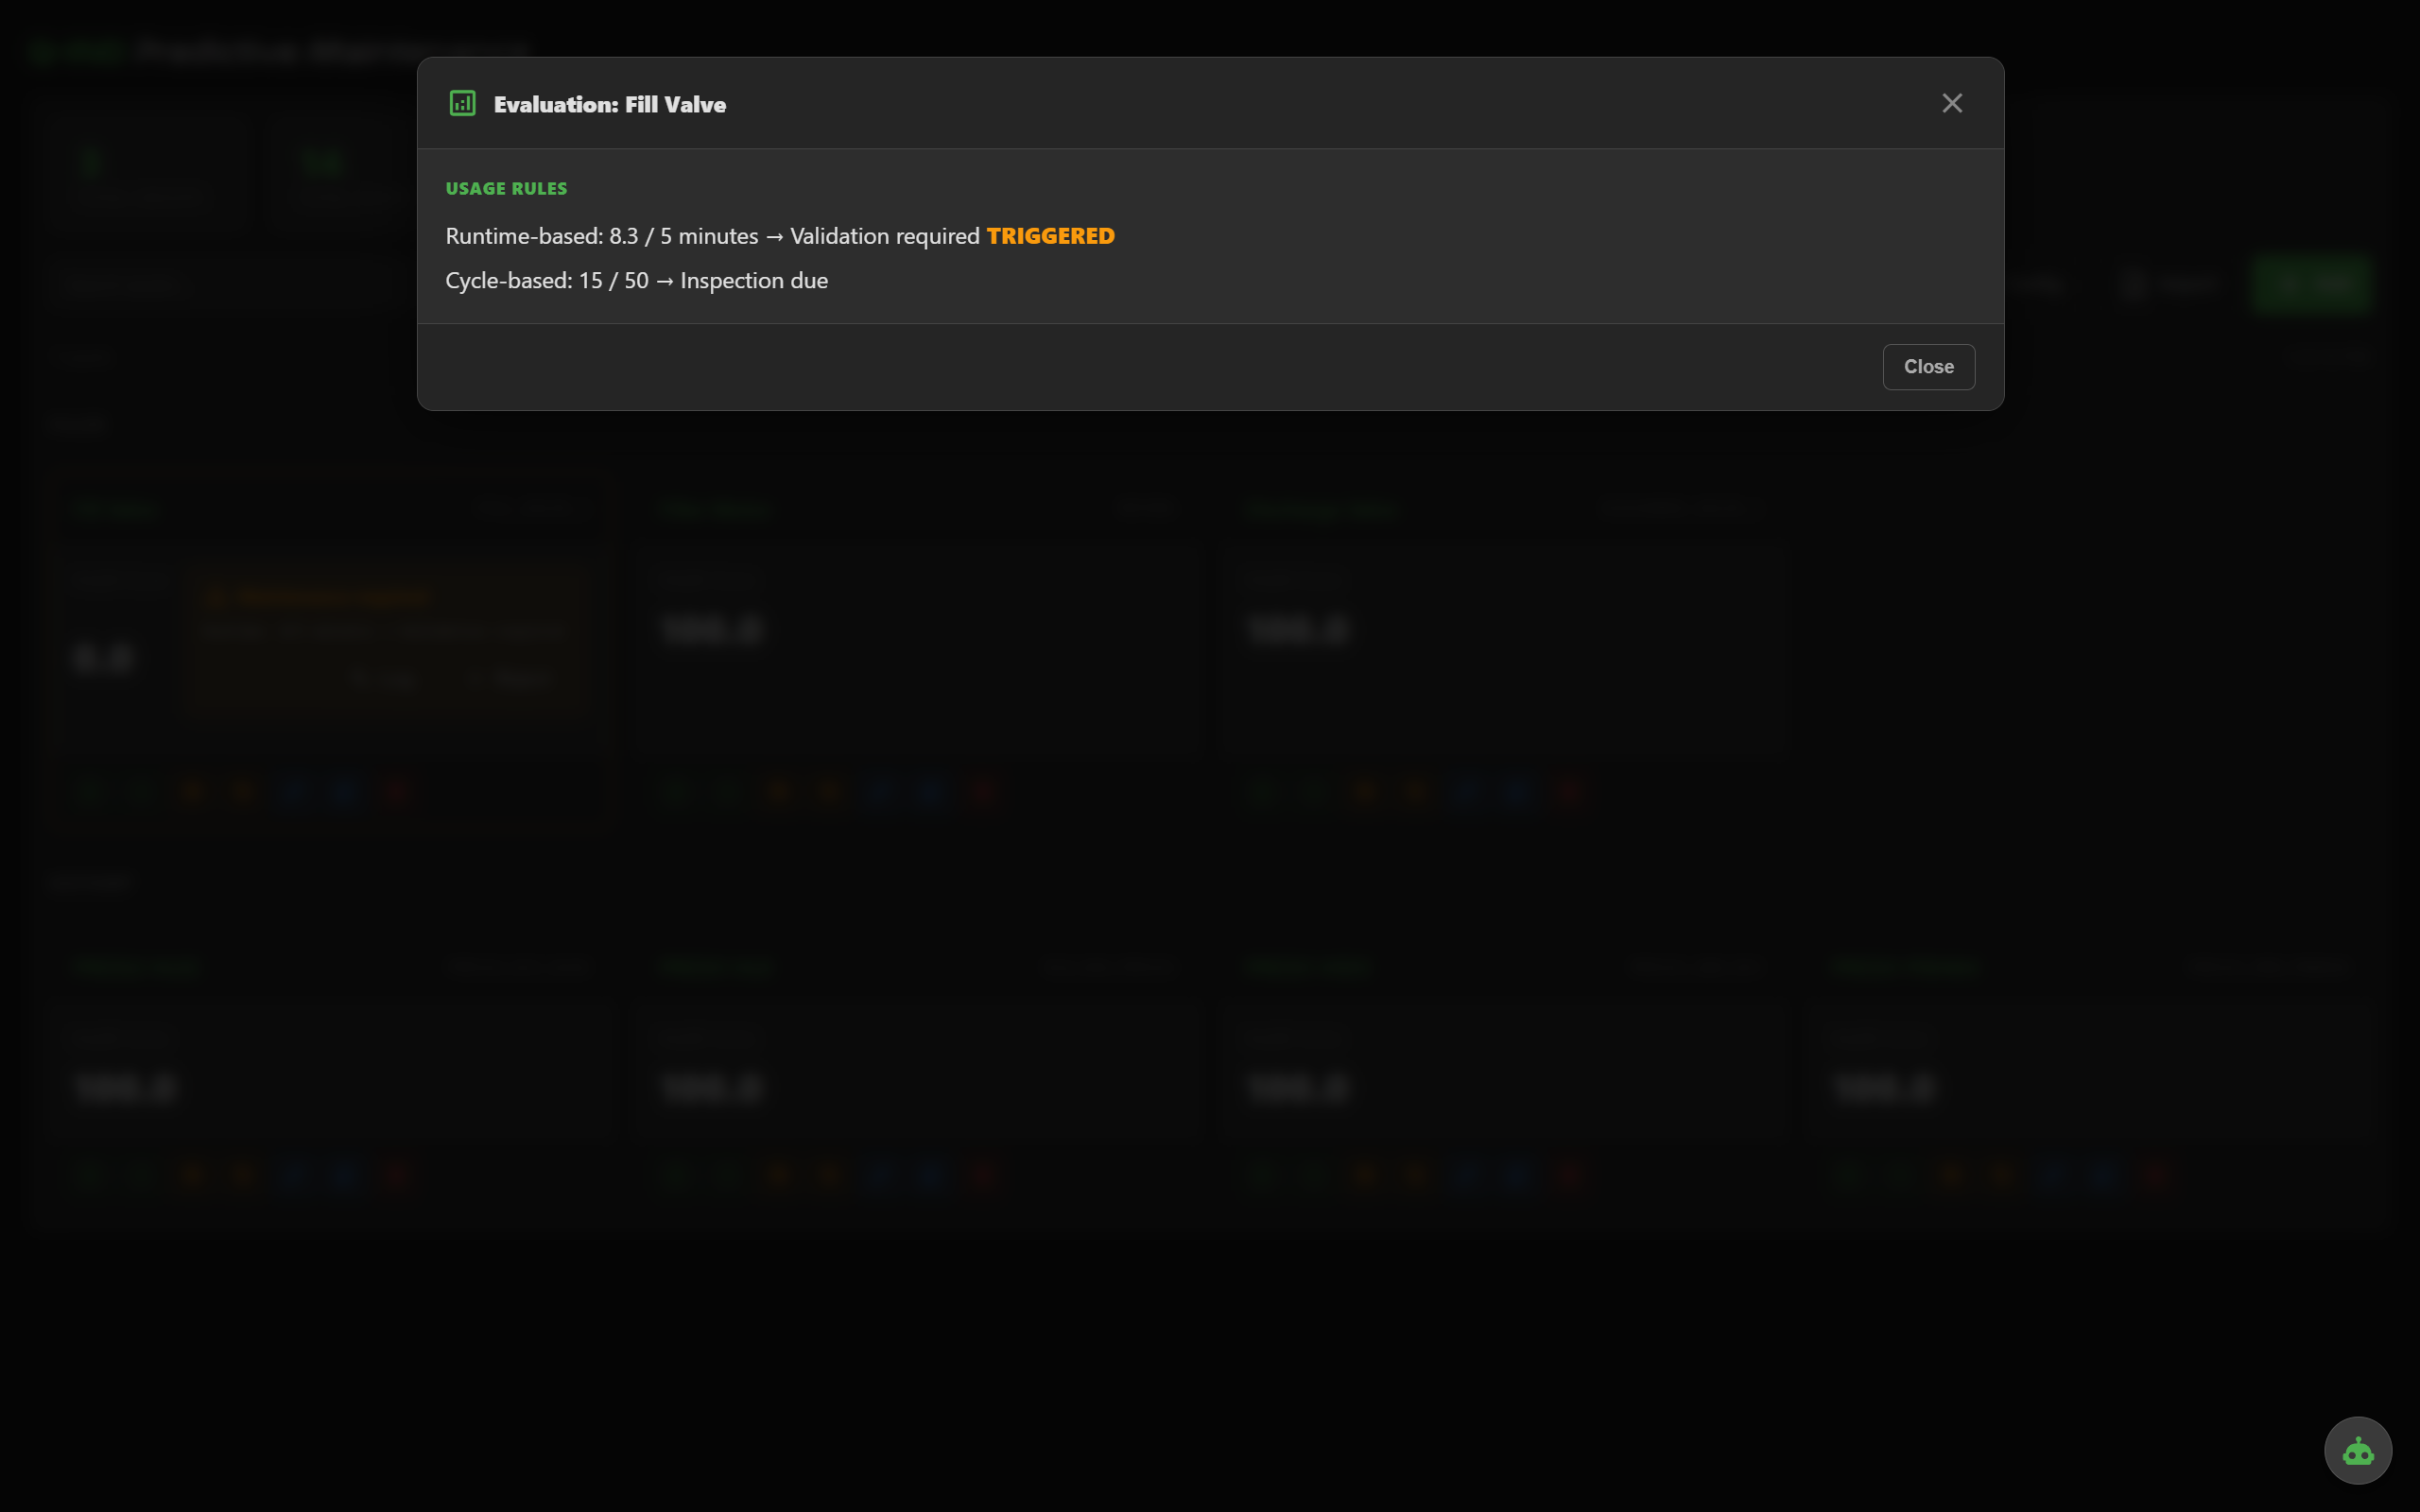
Runtime-hours and cycle-count thresholds — trigger inspection windows without needing a sensor.
Define assets, signals and rules in the UI — no code, no model retraining cycles.
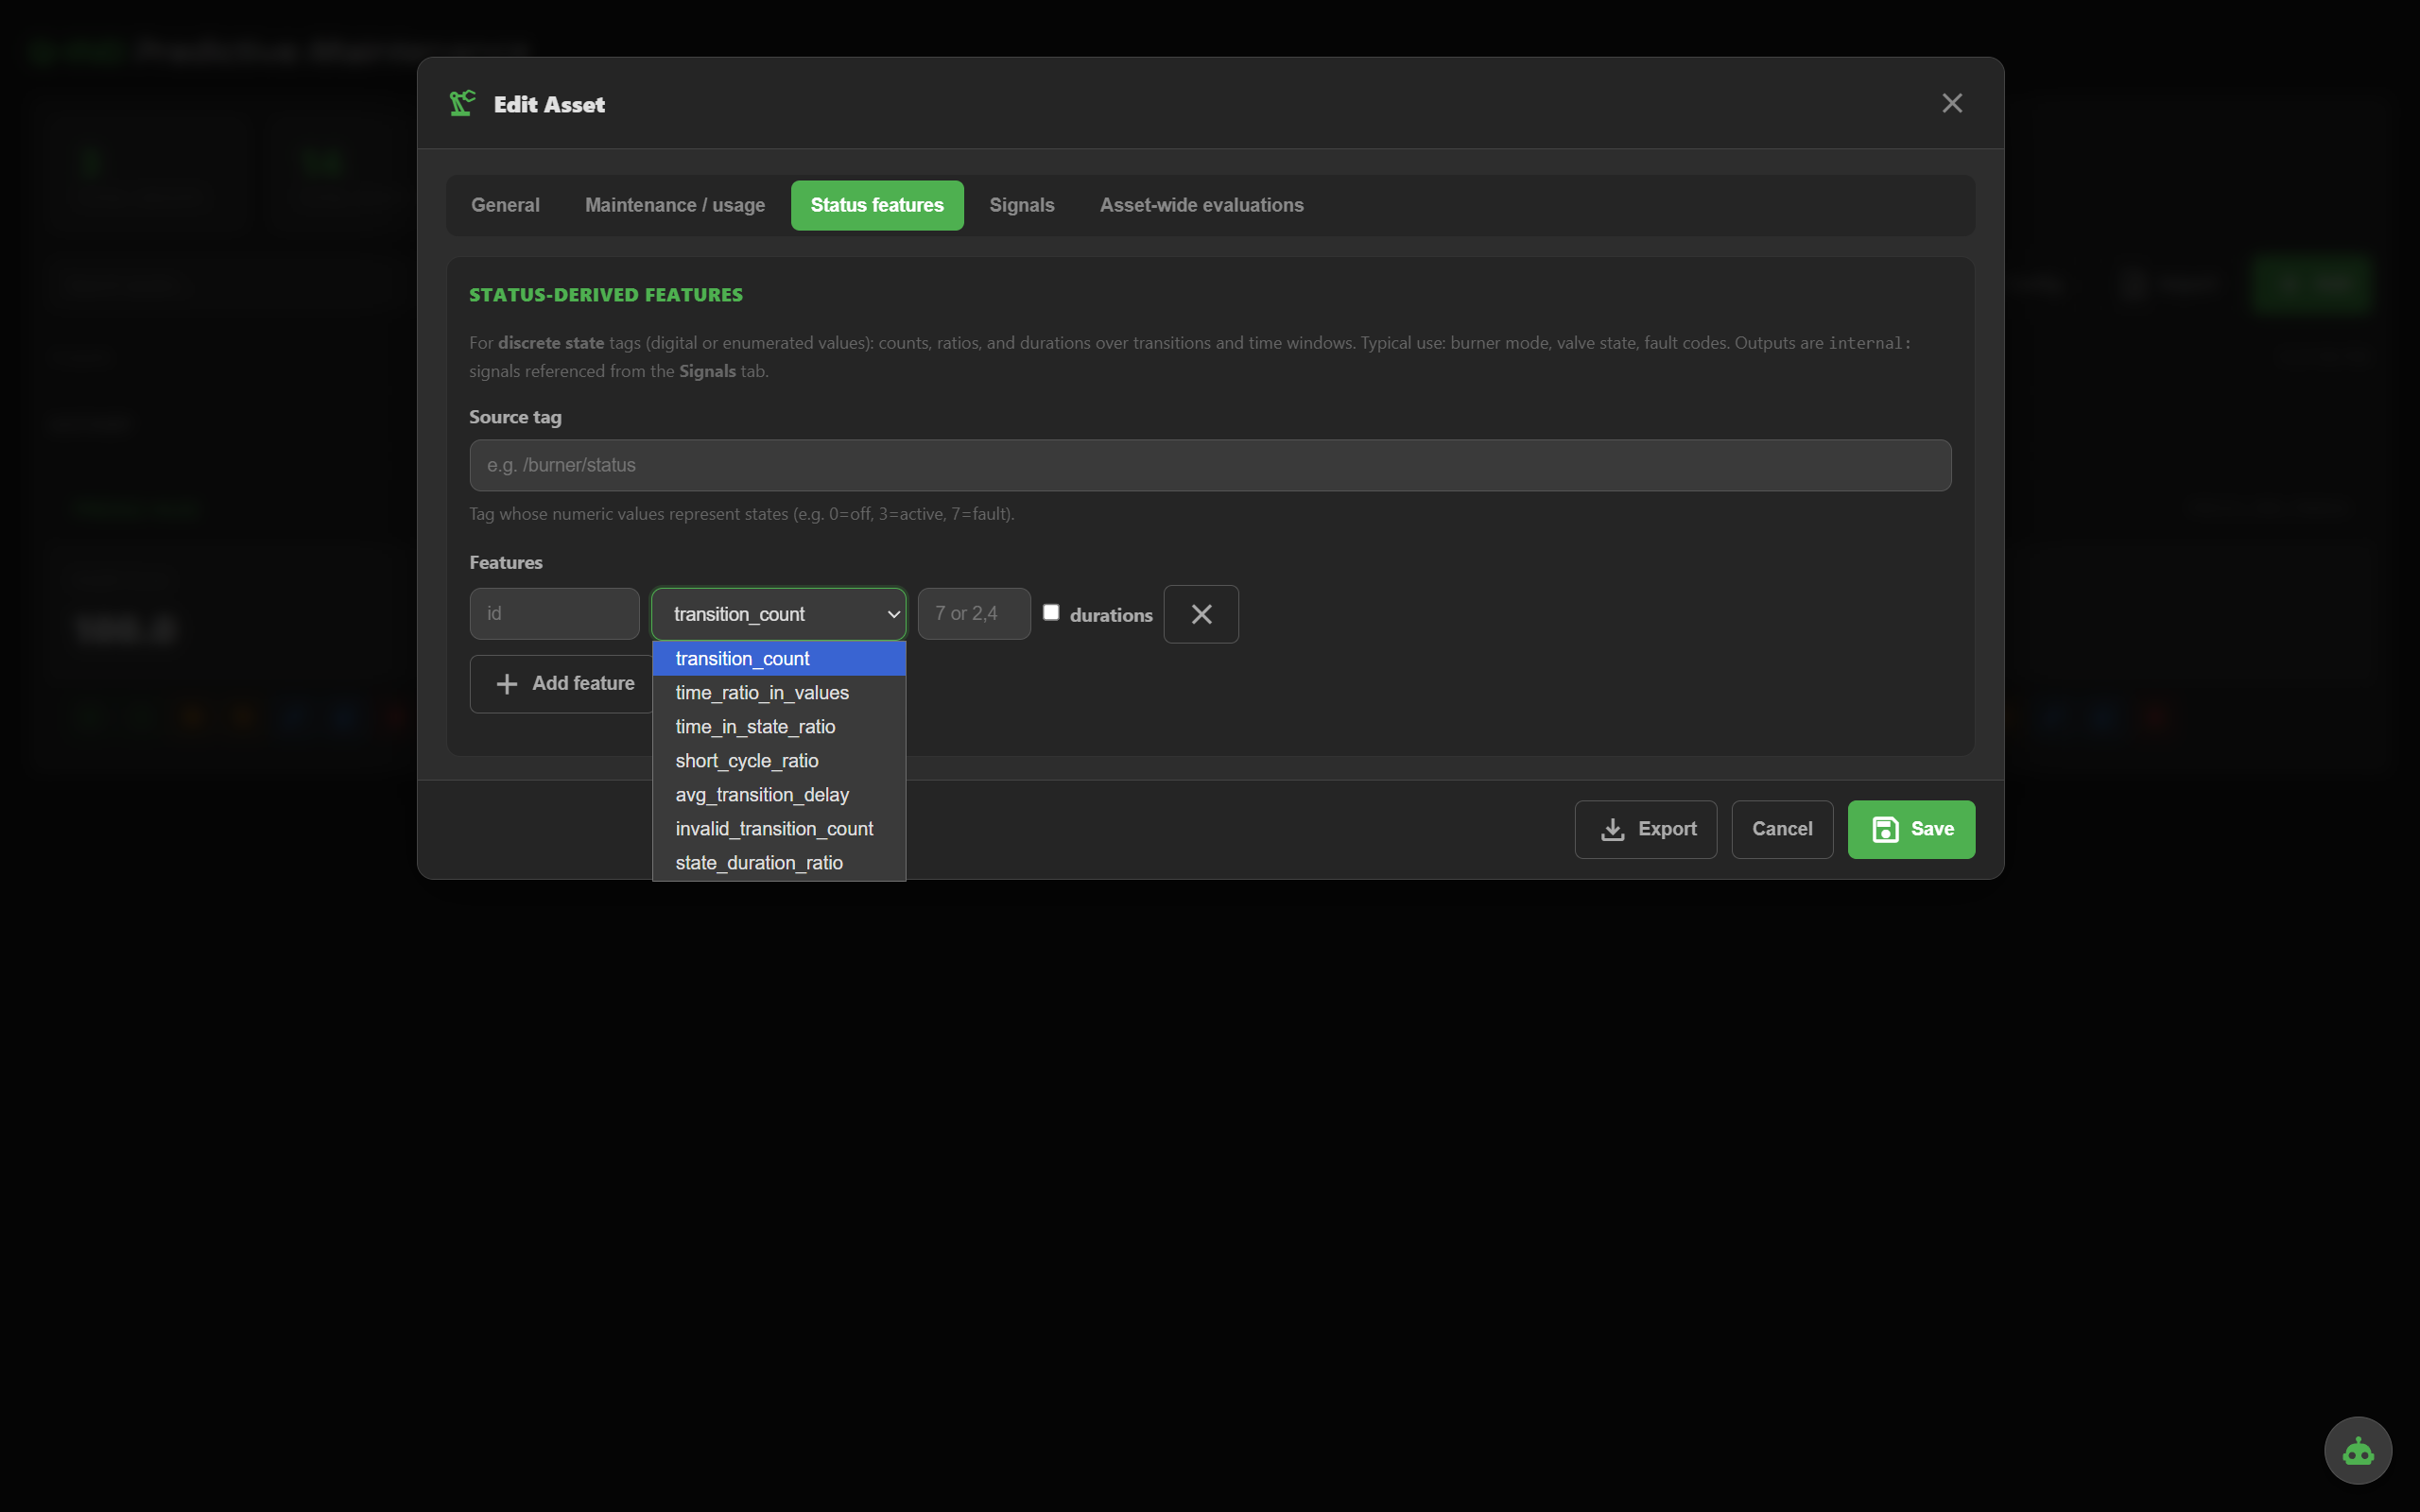
Auto-compute fault counts, time-in-state ratios, short-cycle ratios from a process state tag.
Every asset gets a 0–100 health score and a health level — with top contributors and the rule that triggered them.
Different failure modes need different math. Q-PdM ships with nine methods you can enable per signal — each one tuned to a specific failure pattern, and each one explainable.
Catches unexpected deviations: z = (value − mean) / std over a rolling window. Sensor glitches, sudden overloads.
Linear regression vs. sample index. Bilateral, increasing-only or decreasing-only. Catches gradual degradation Z-score misses.
Exponentially weighted moving average. Detects slow baseline shifts, emphasizing recent data.
Cumulative sum control. Detects small, sustained shifts — classic industrial SPC technique.
Ratio of recent std vs. baseline std. Many machines get noisier before they fail, even before the mean moves.
"Above X for Y minutes". Accumulative since last maintenance, or consecutive uninterrupted run.
For 0/1 signals: equipment ran continuously beyond a duration limit.
For 0/1 signals: equipment stuck off for too long — expected to be active and isn't.
Counts 0↔1 transitions in a period. Excessive cycling is a classic precursor to relay/contactor failure.
Compares each asset against its group: relative ratio, peer z-score, rank, deviation score. Spots outliers that look fine on their own.
From asset definition to live monitoring — every step in one UI.
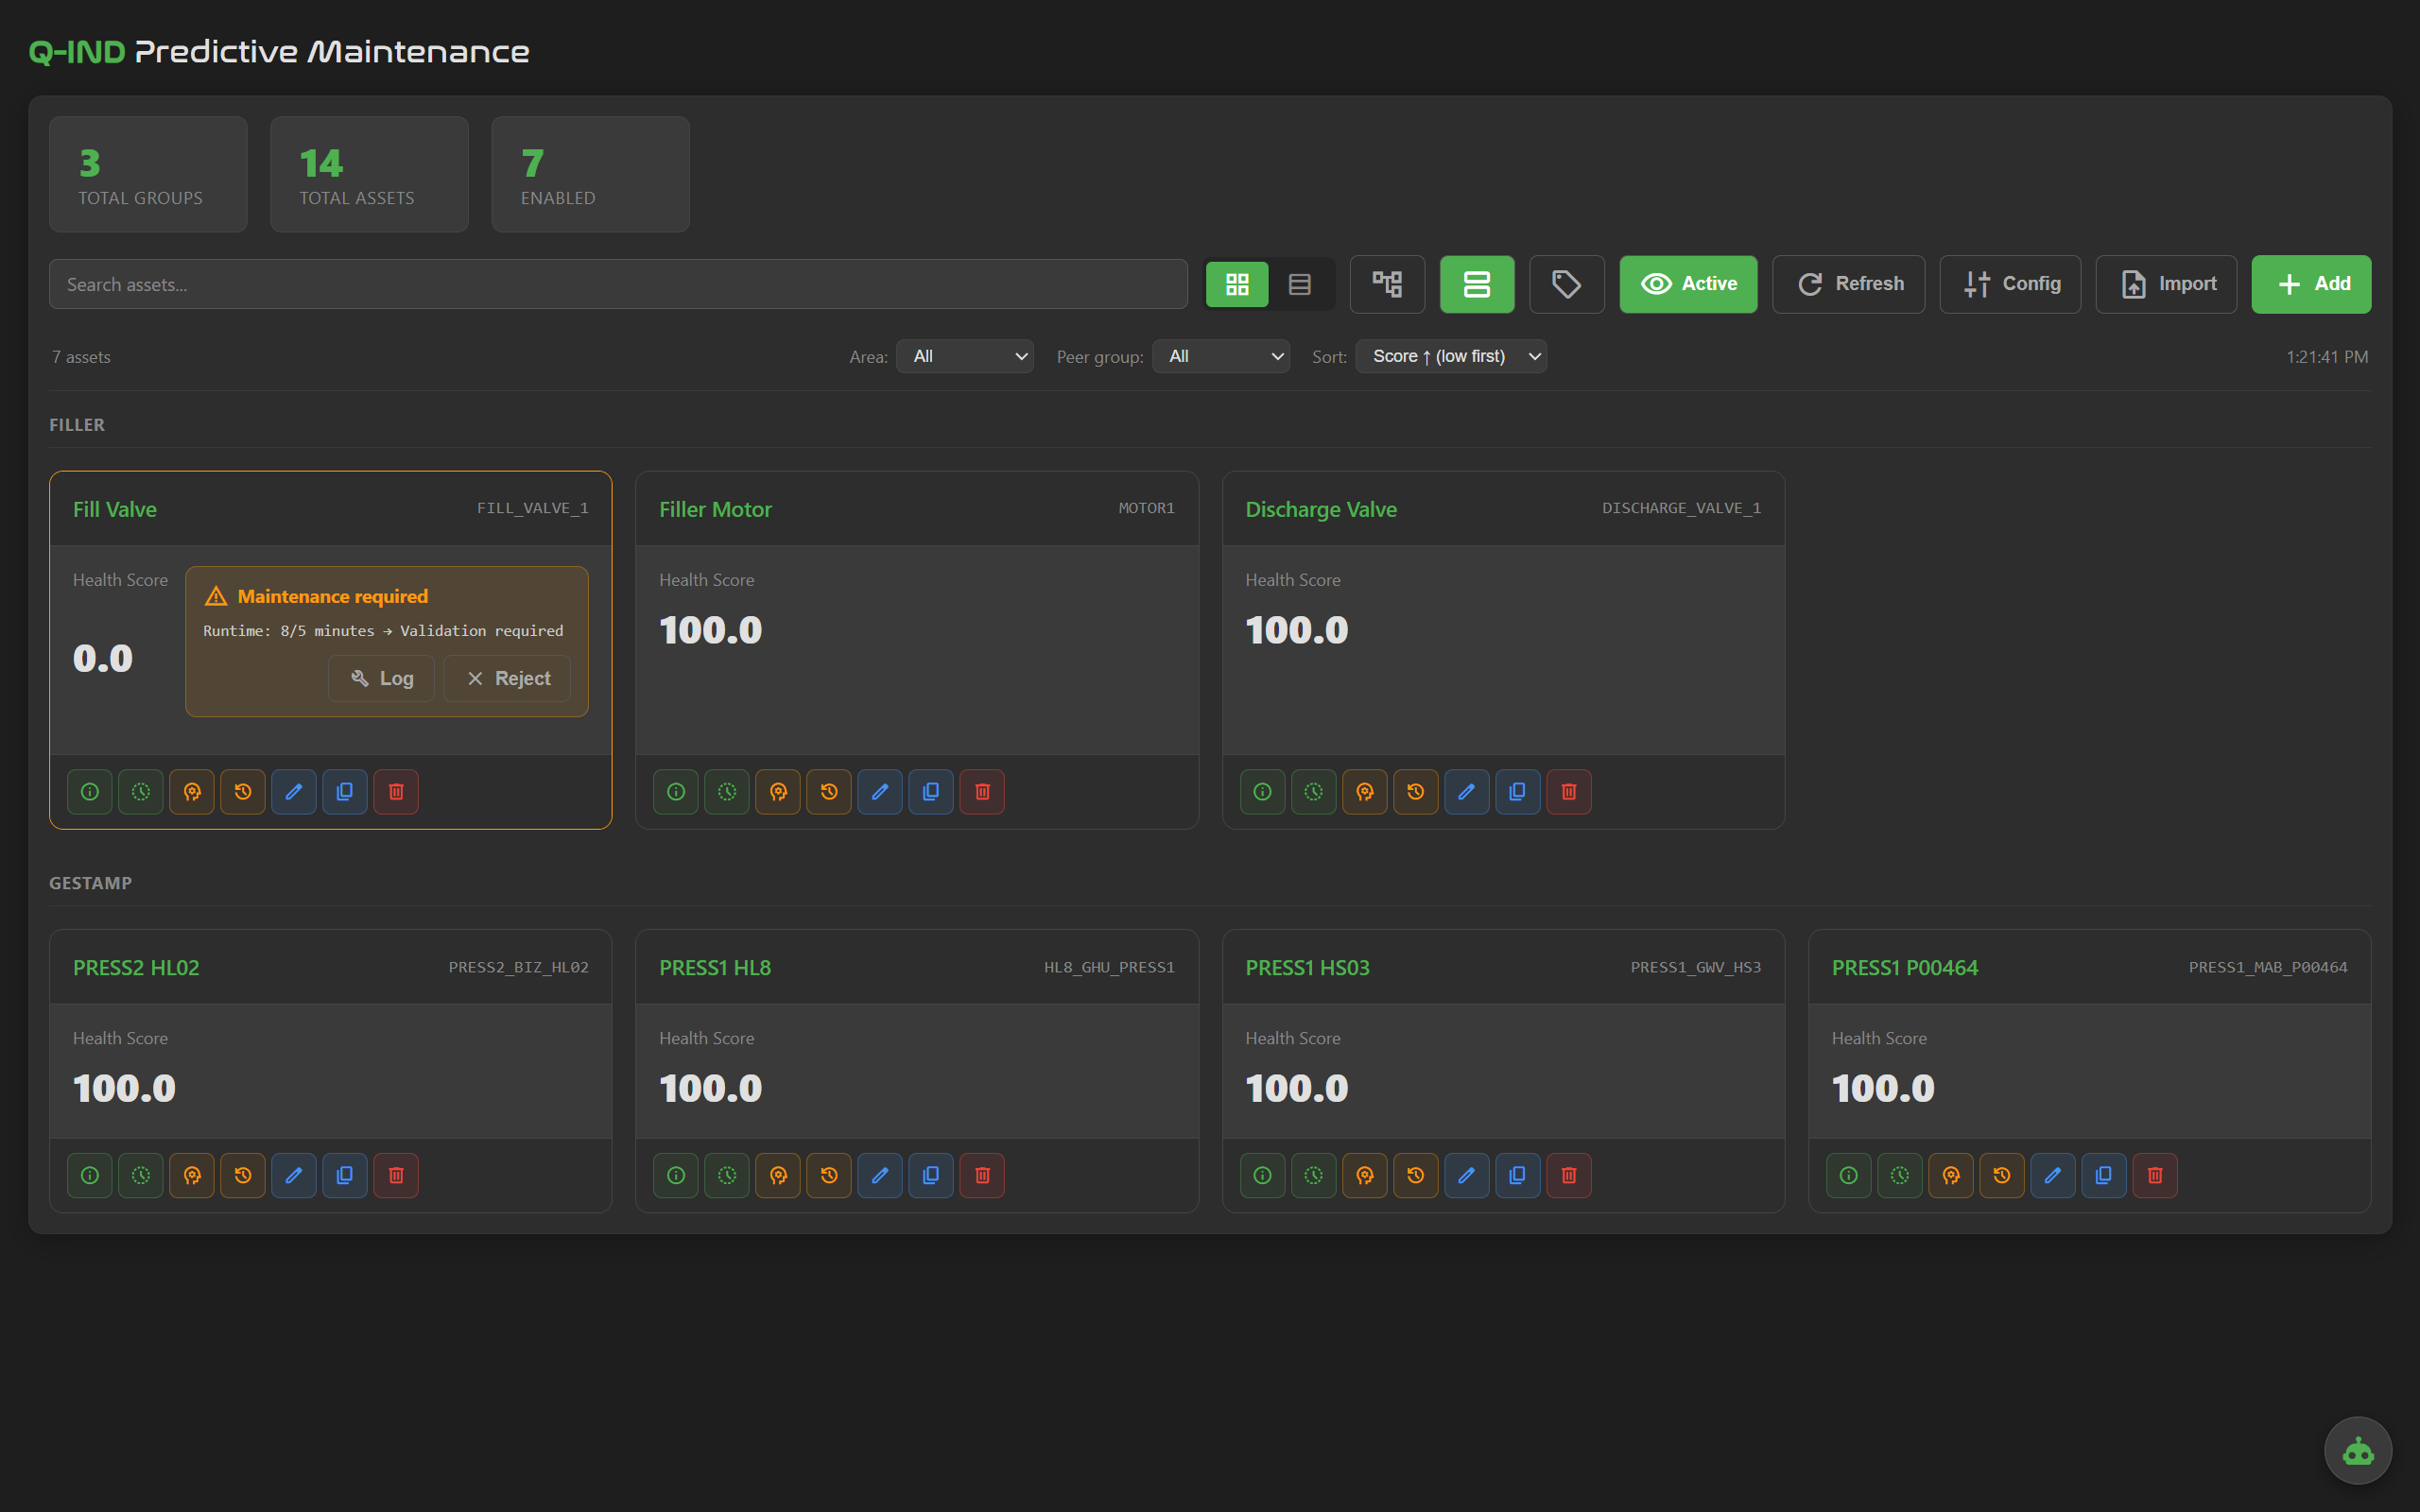
— Live monitoring —
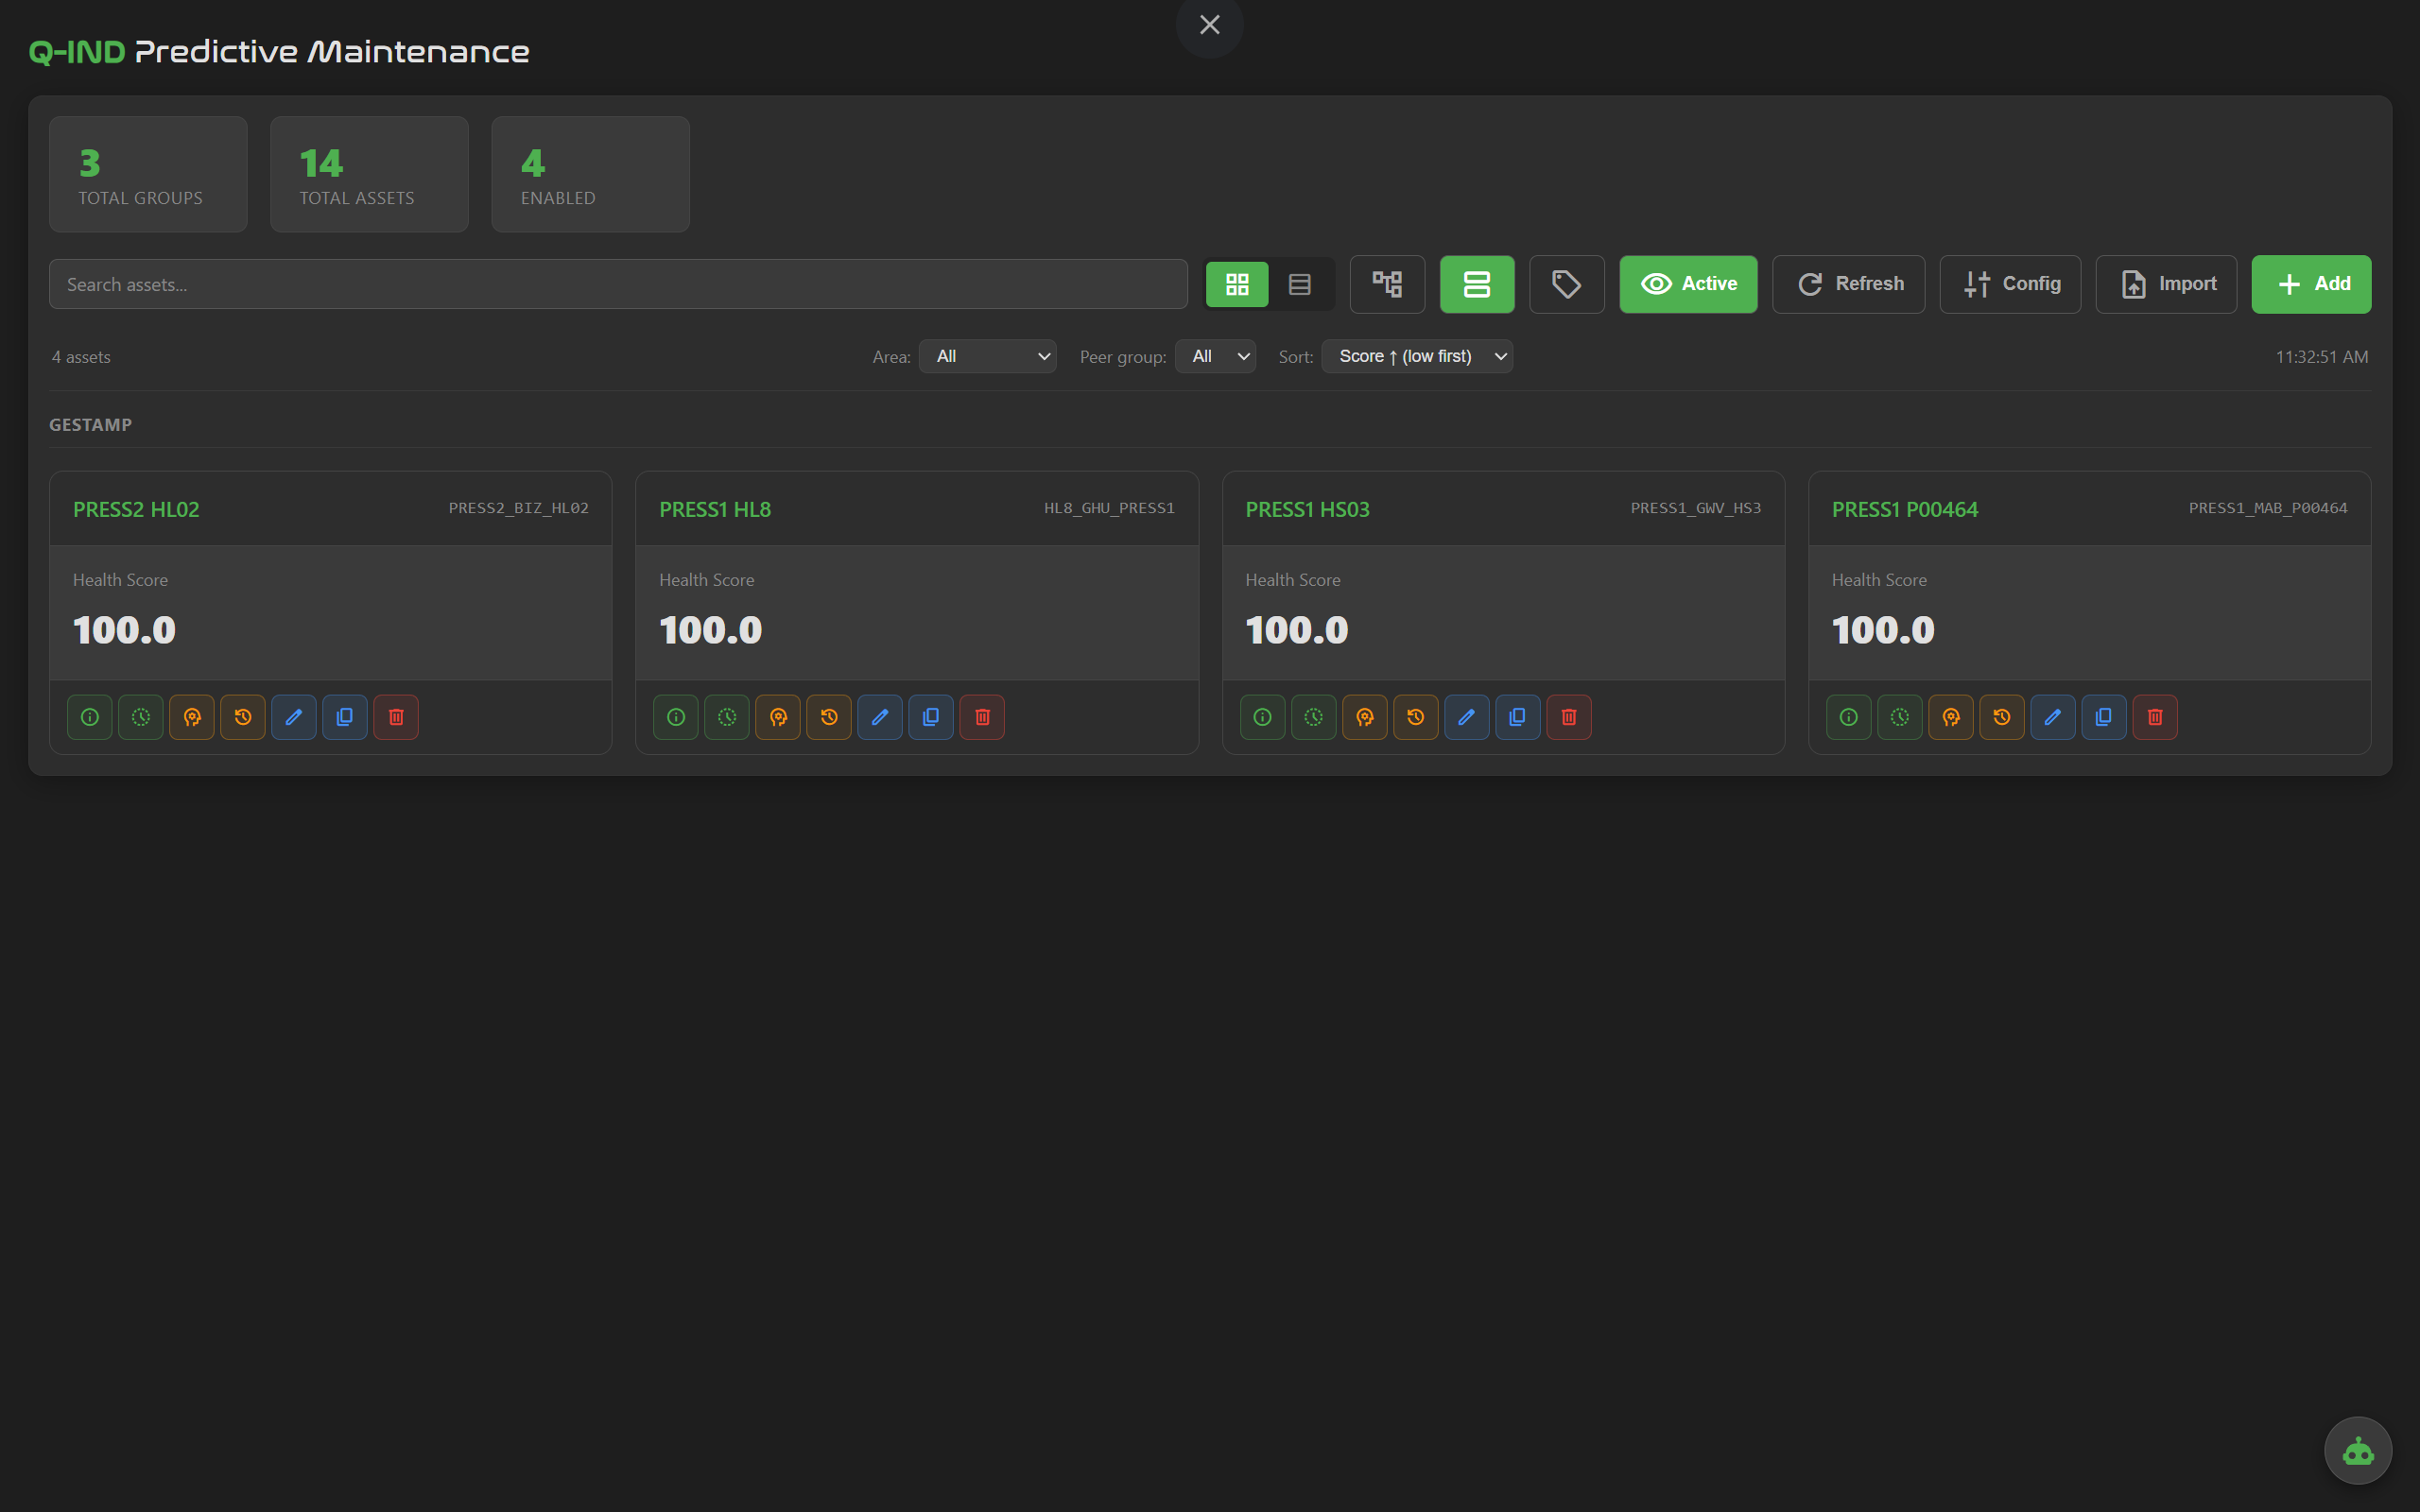
Every asset on one screen, grouped by line or area. Health score, anomaly state and top contributors update live.
— Configuration —
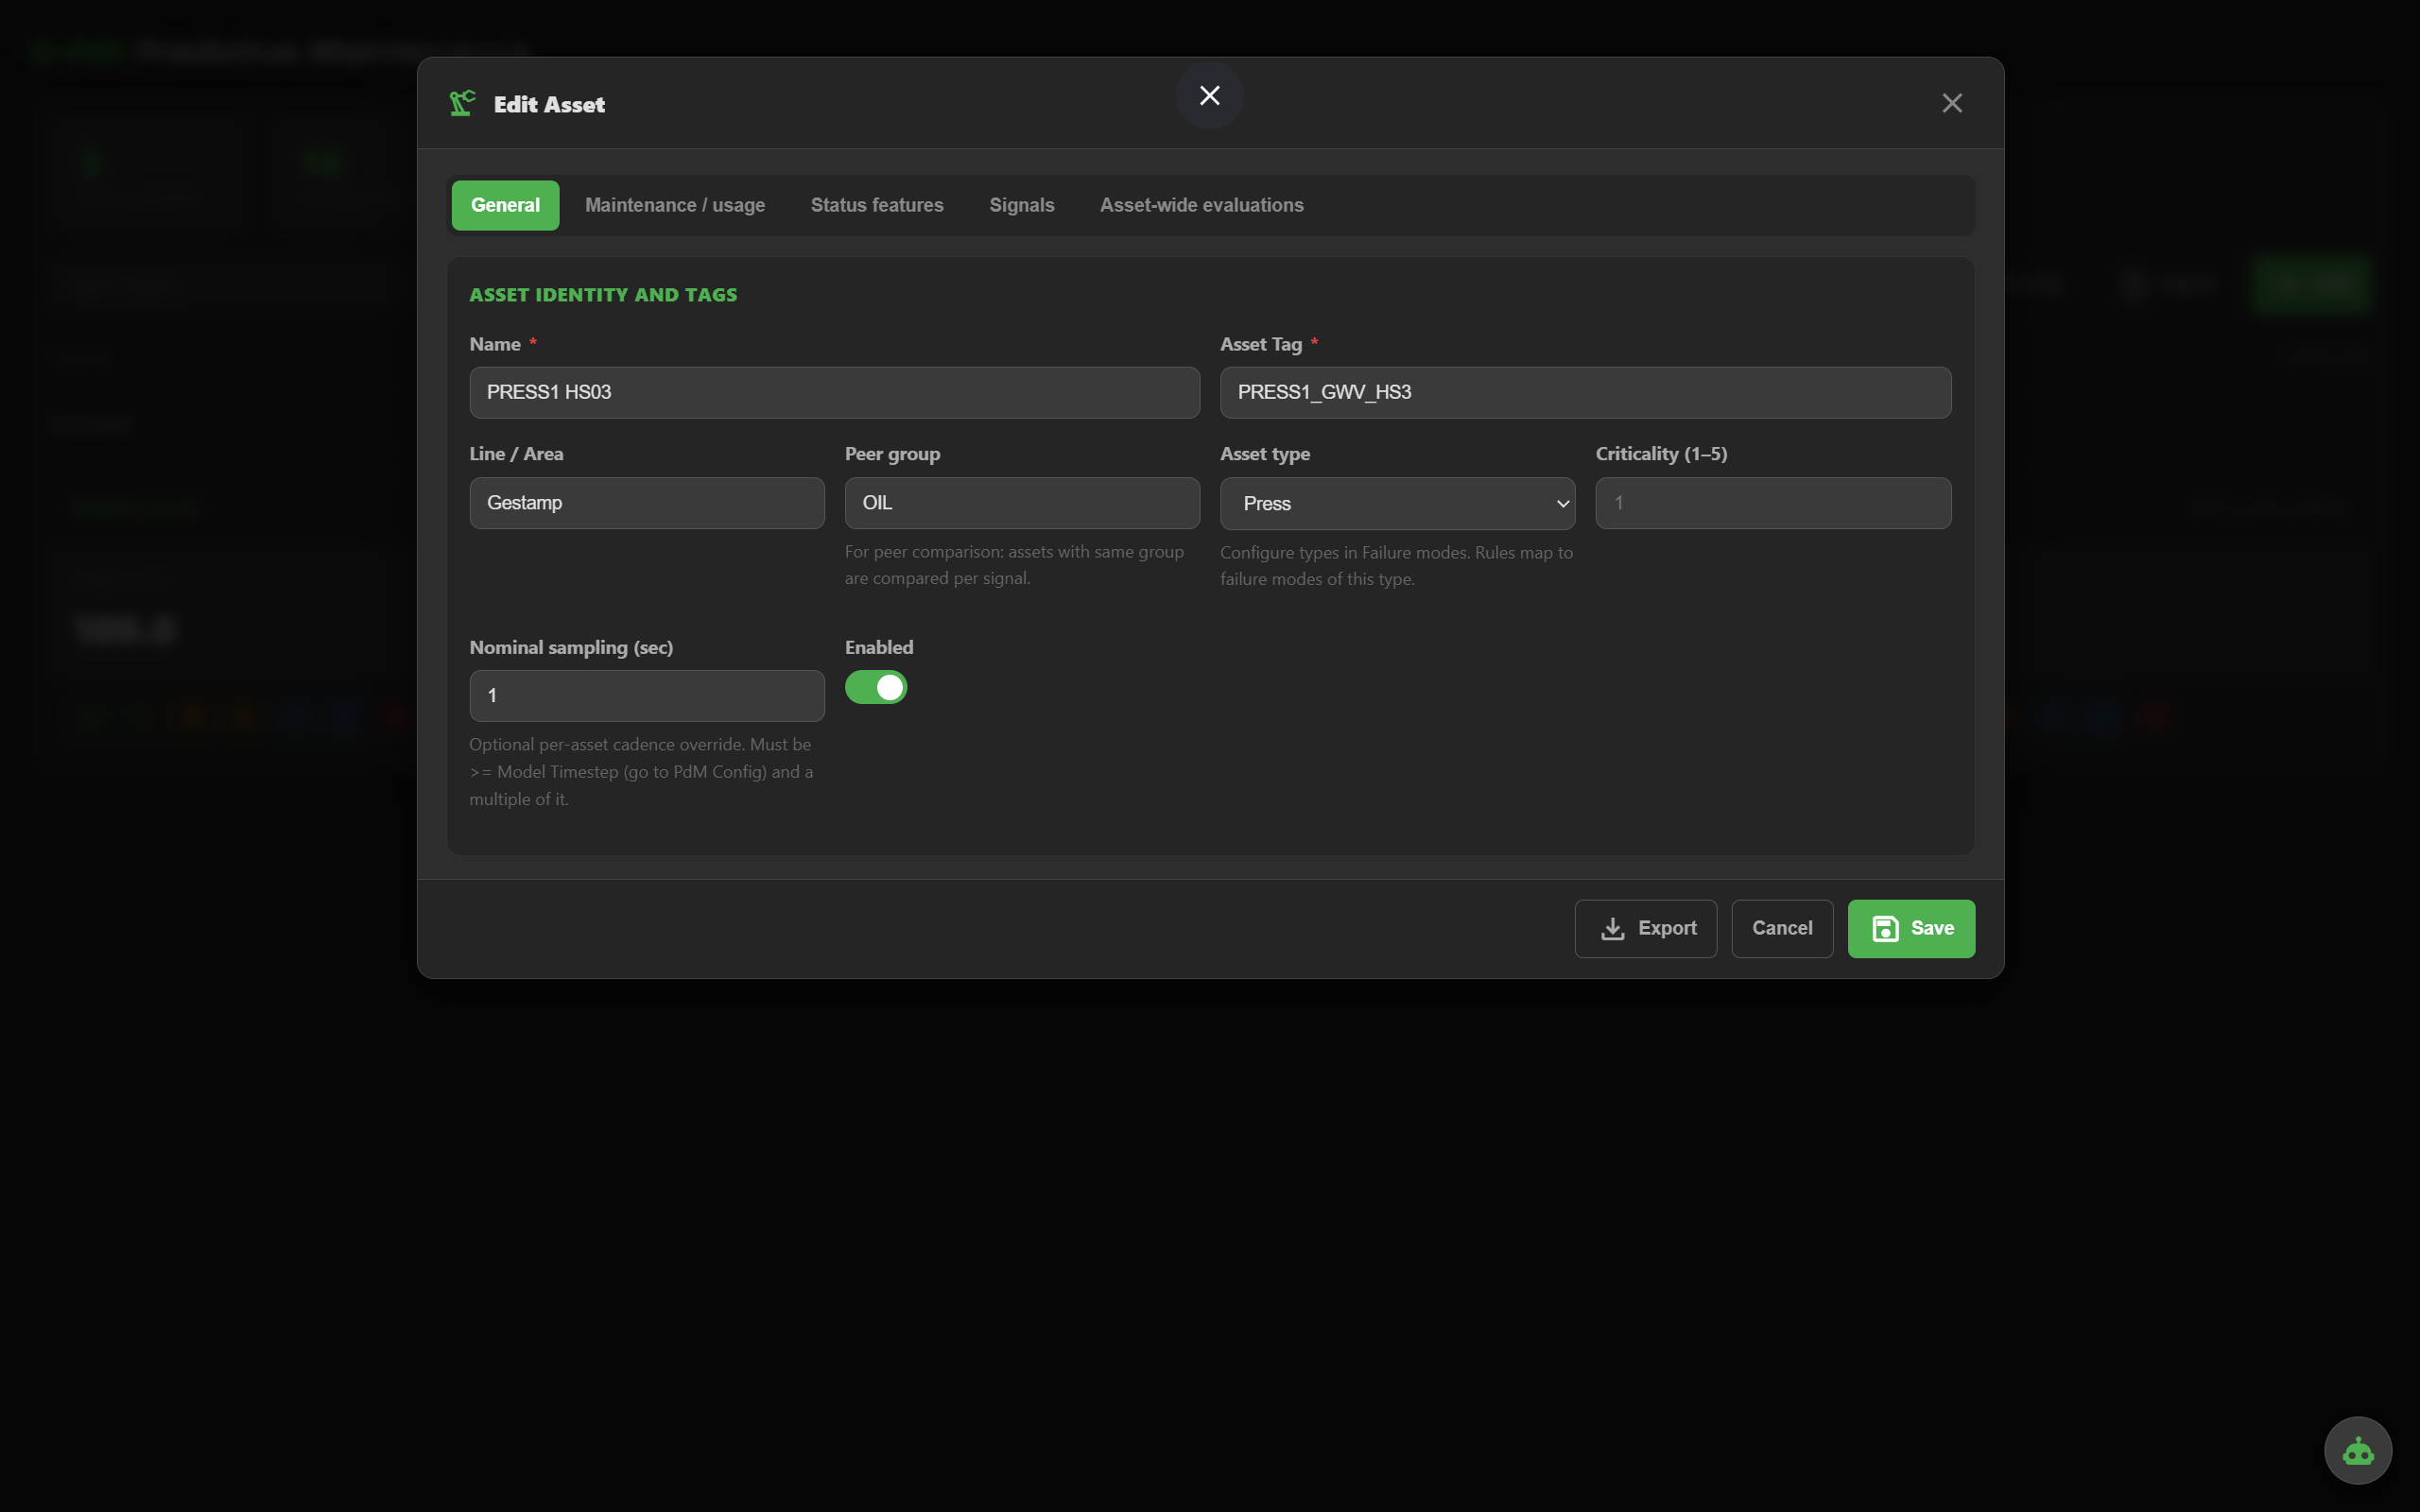
Name, tag, line/area, asset type, criticality, nominal sampling, peer group. The basics that drive everything else.
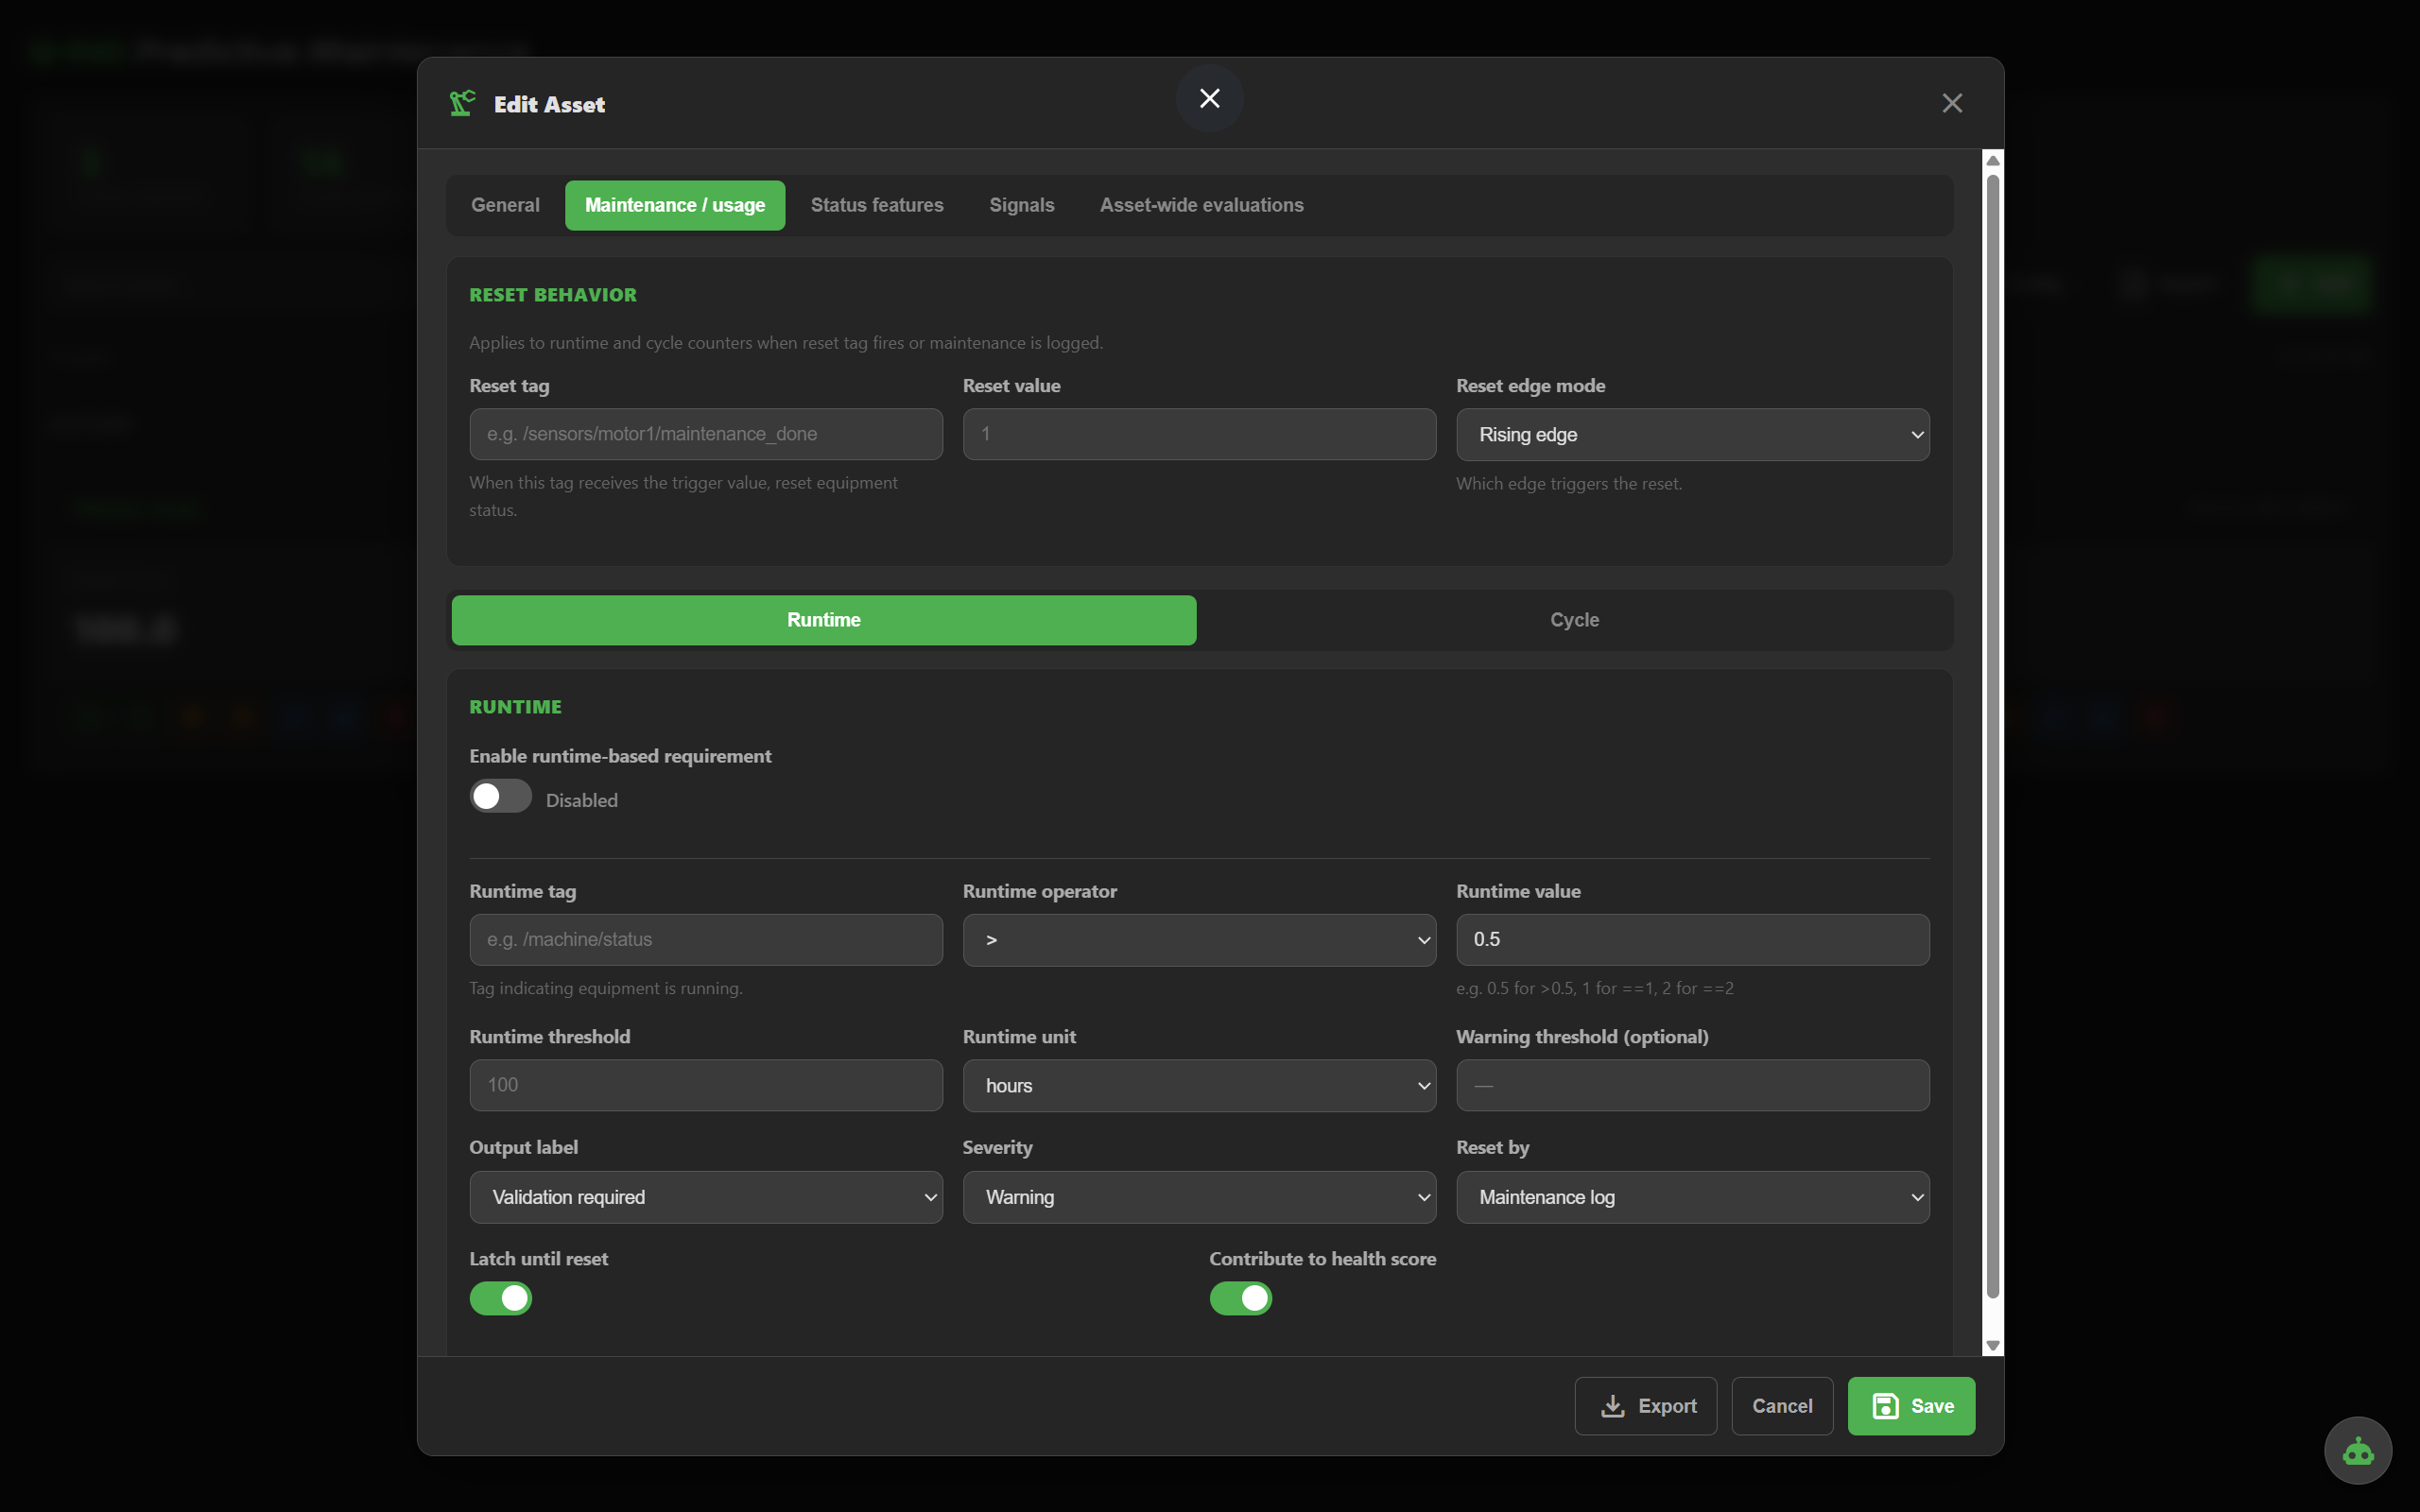
Track running hours since last maintenance. Trigger an inspection window when accumulated runtime hits the threshold — no special sensor required.
>, >=, ==, etc.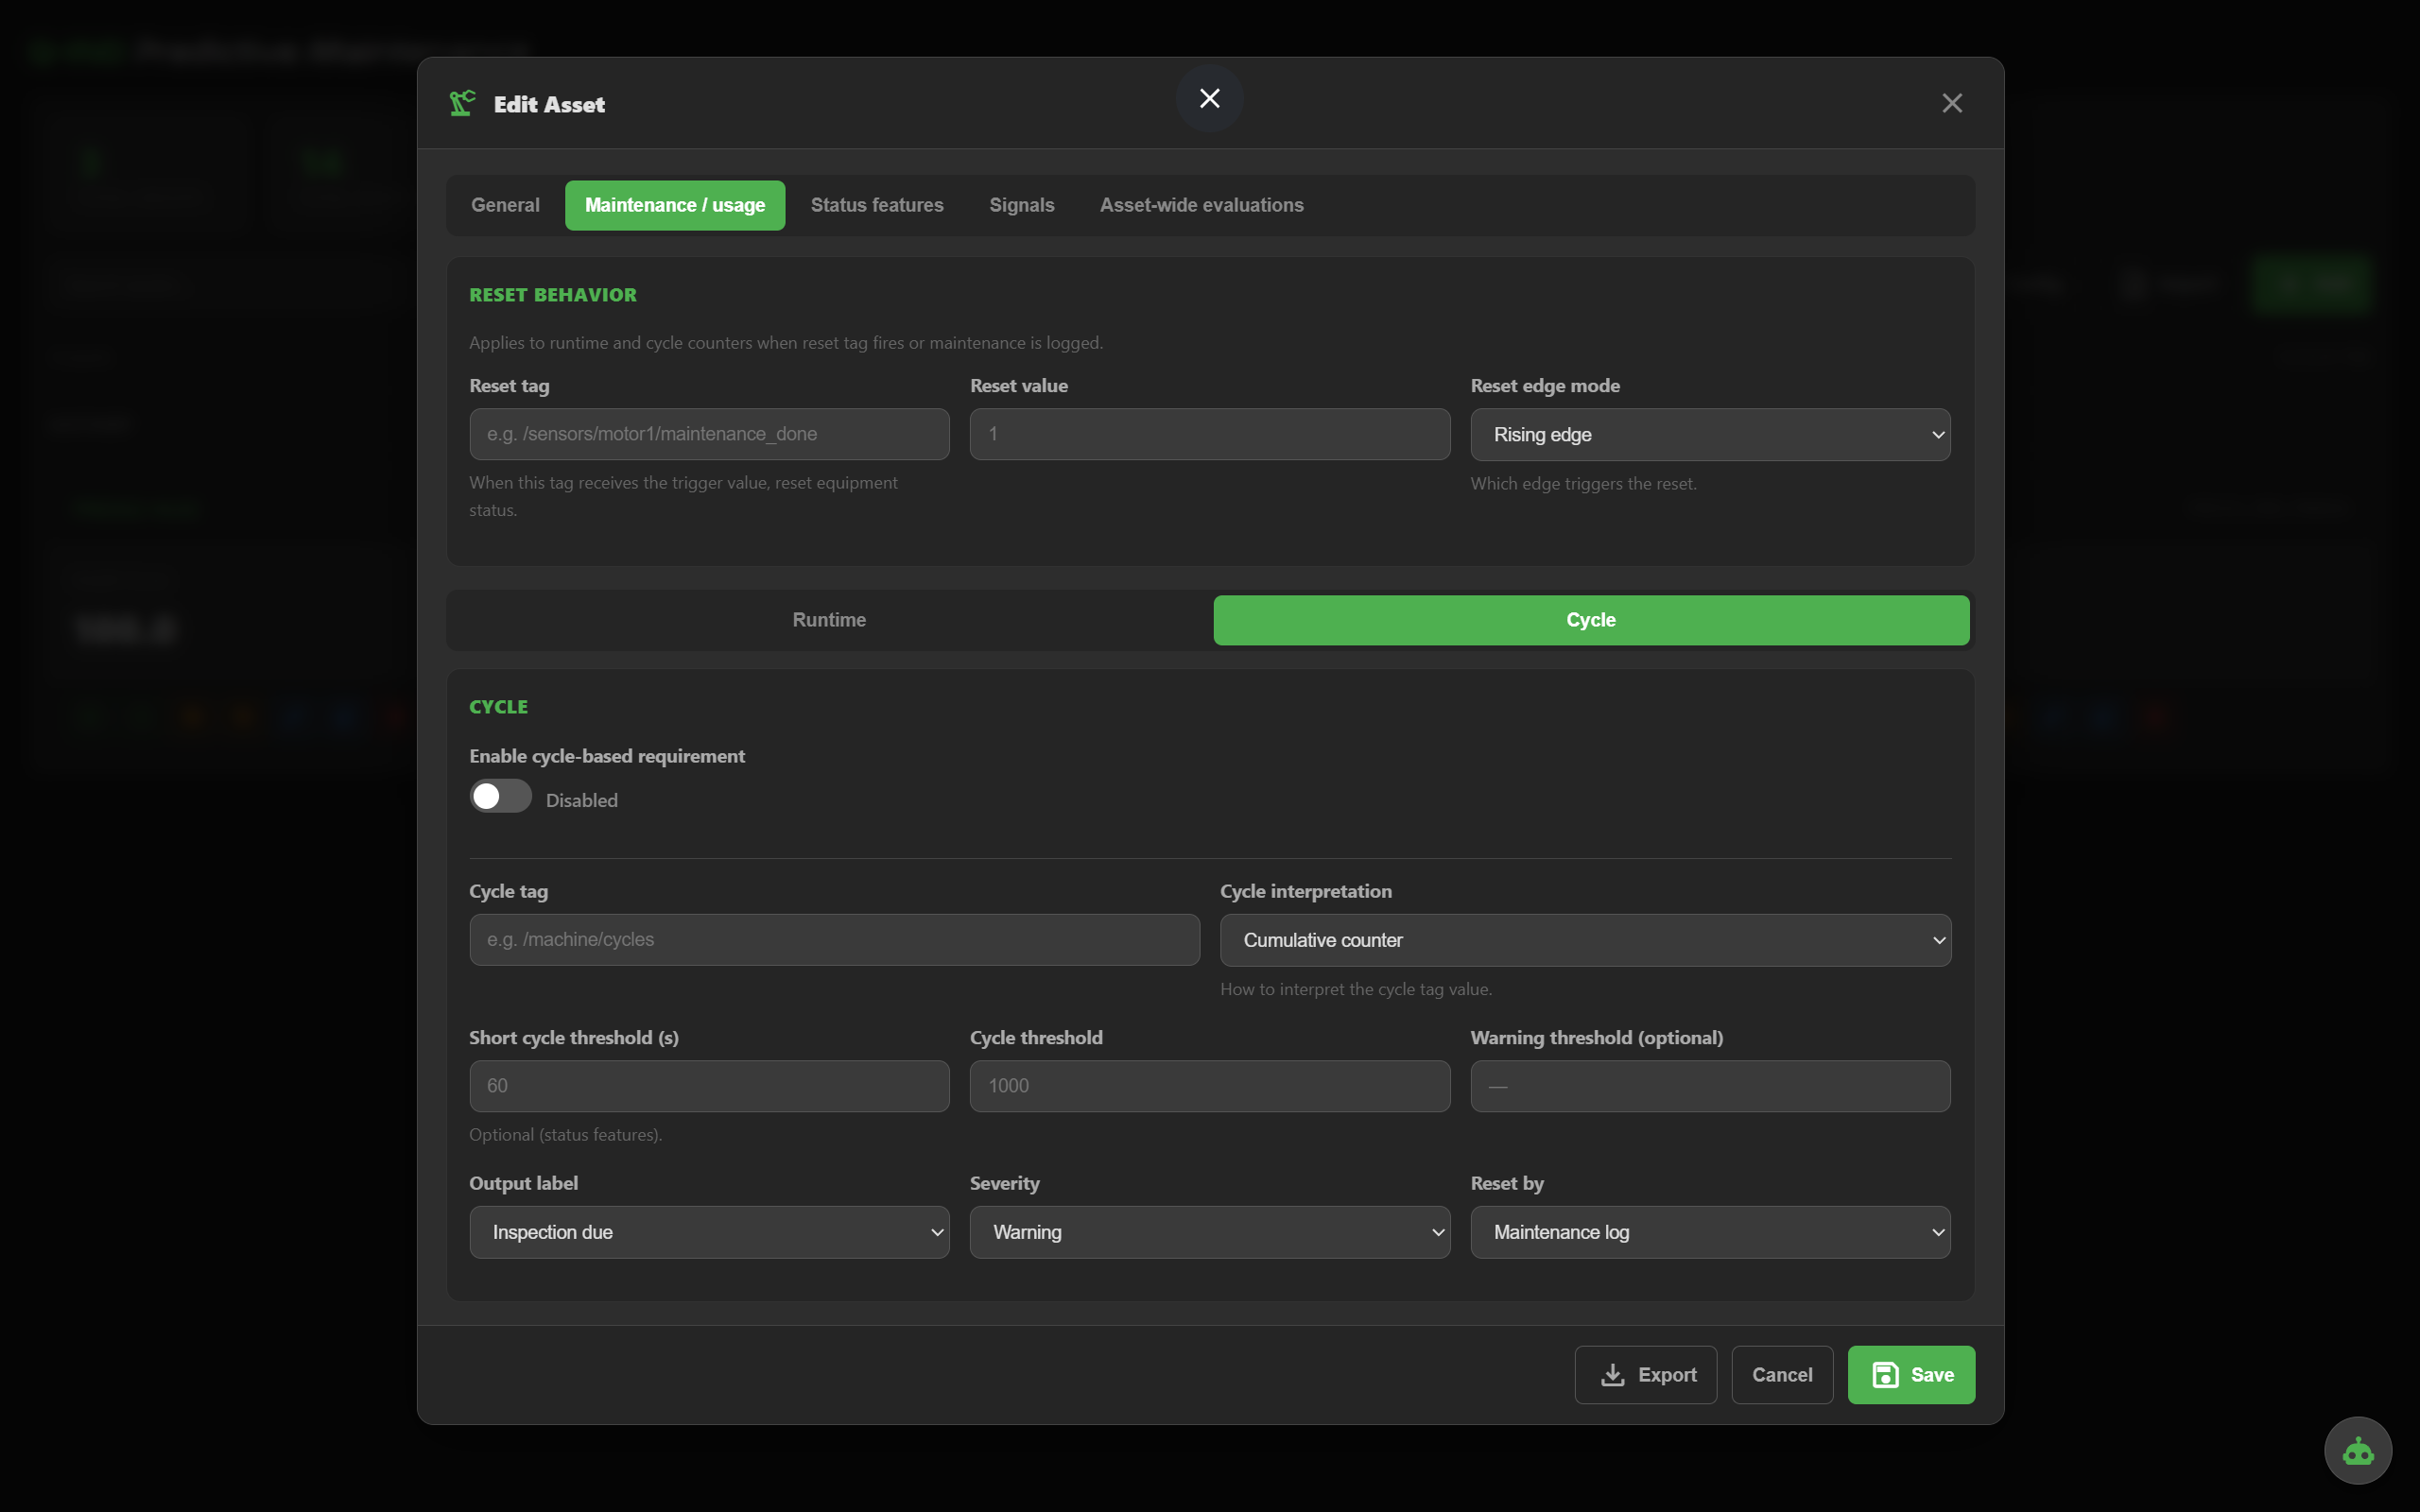
Count cycles from a monotonic counter or by counting transitions to a specific value. Trigger inspection when the cycle threshold is hit.
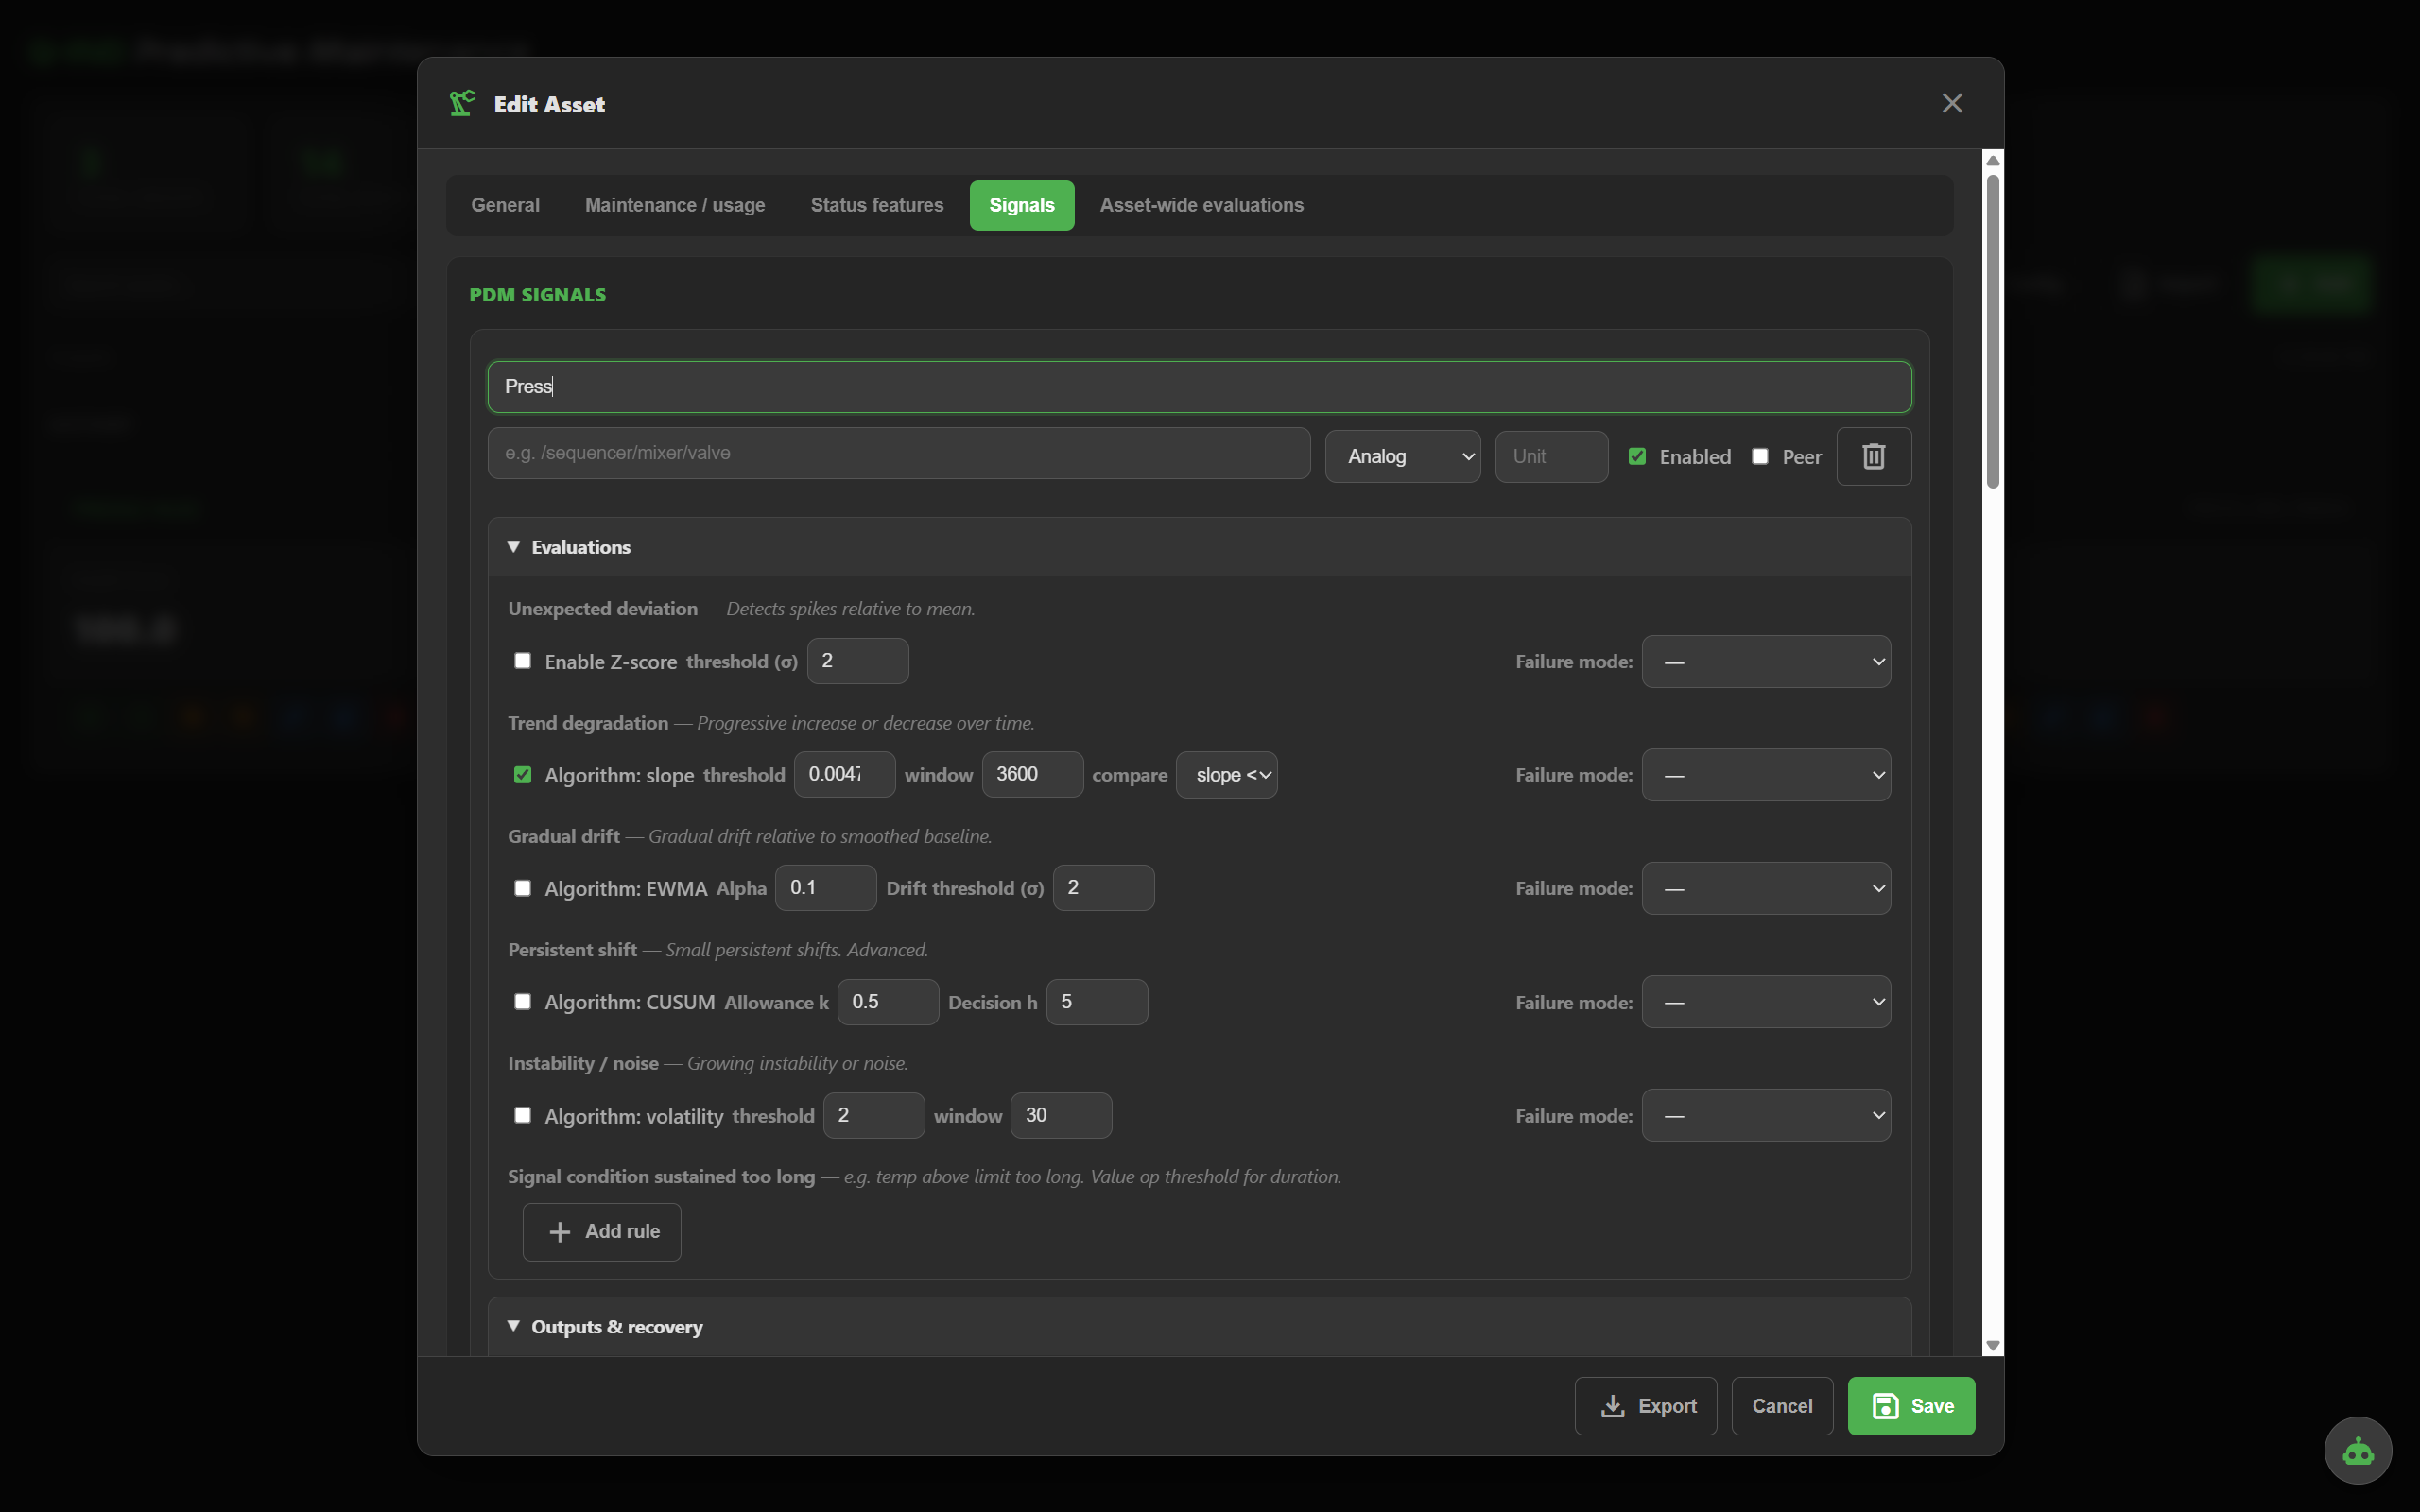
For each analog signal, enable any combination of the nine methods. Each evaluation row has its own failure mode mapping — so the diagnostic is meaningful, not just "anomaly".
For 0/1 signals: activeTooLong, stuckState, transition frequency. Catch contactors that flap, valves stuck open, equipment that ran past its duty cycle.
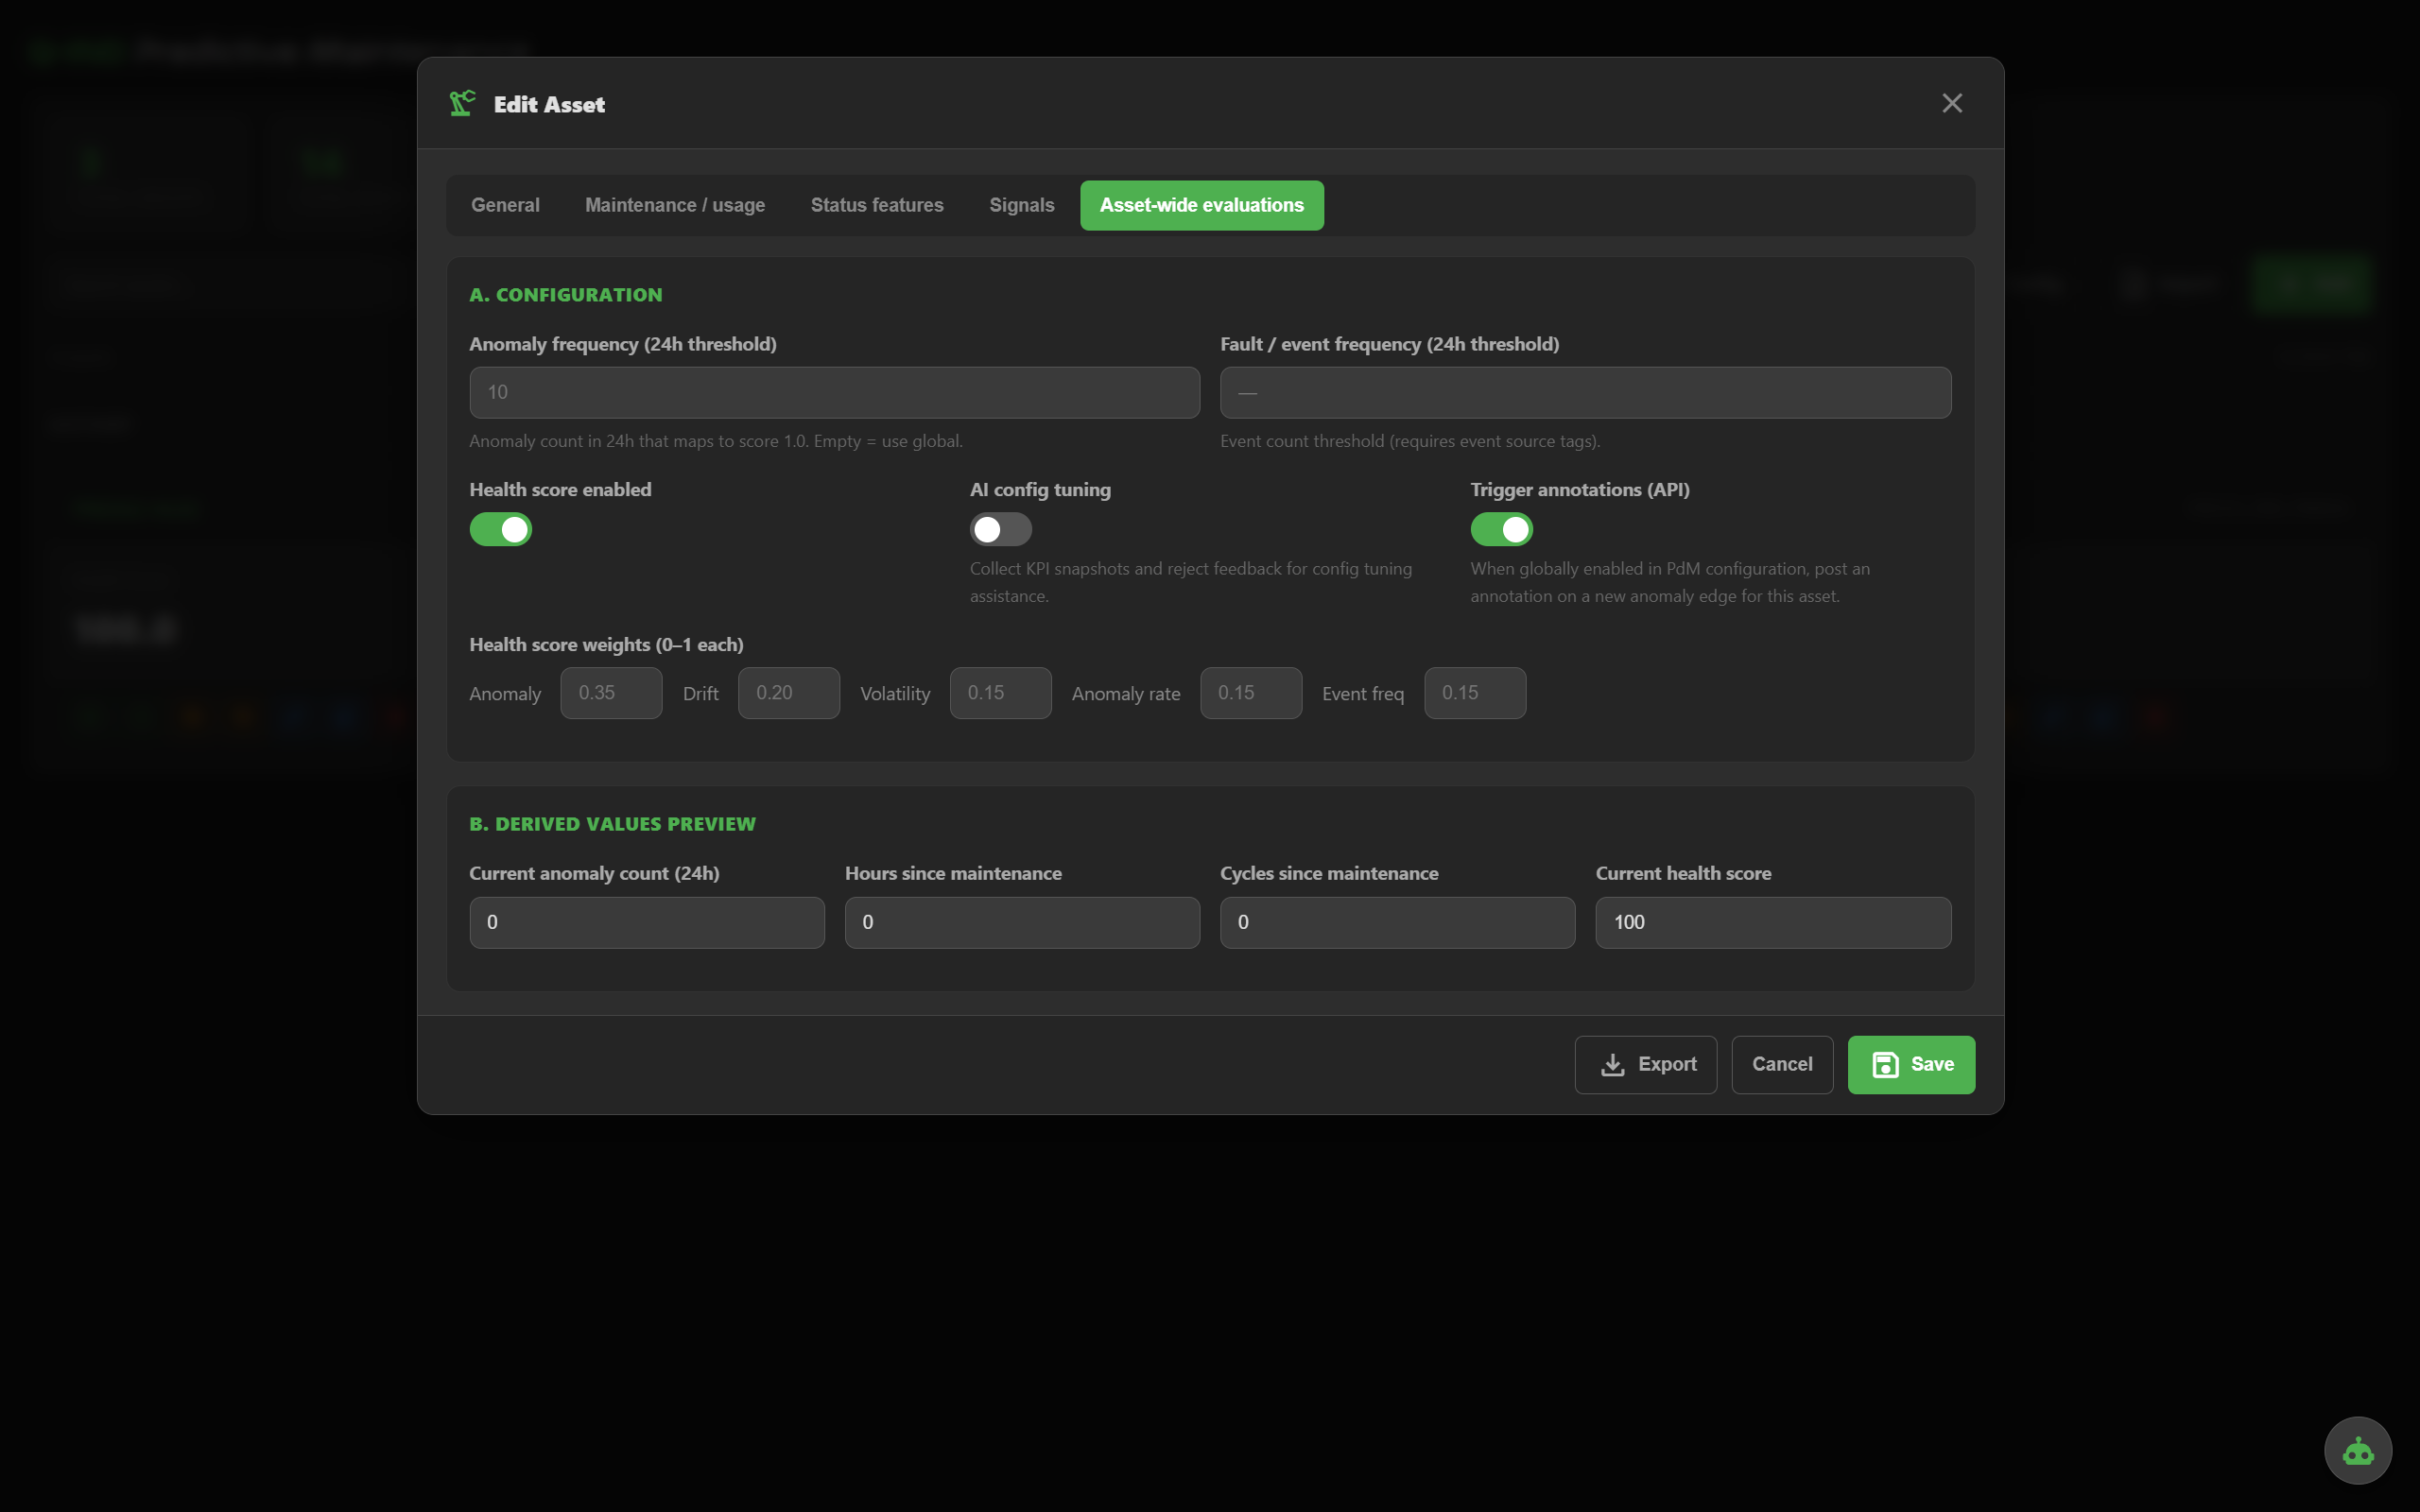
Tune the health formula: anomaly weight, drift, volatility, anomaly-rate, event frequency. Toggle annotations and AI tuning per asset.
— Runtime & diagnostics —
See exactly what fired: which signal, which rule, which value, against which threshold. Anomaly is never a black box.
Open any asset and inspect every enabled method, its current value, its threshold and its contribution to the health score. Tuning becomes obvious.
Every state transition recorded with timestamp, contributors and the rule that fired. Audit-friendly, searchable.
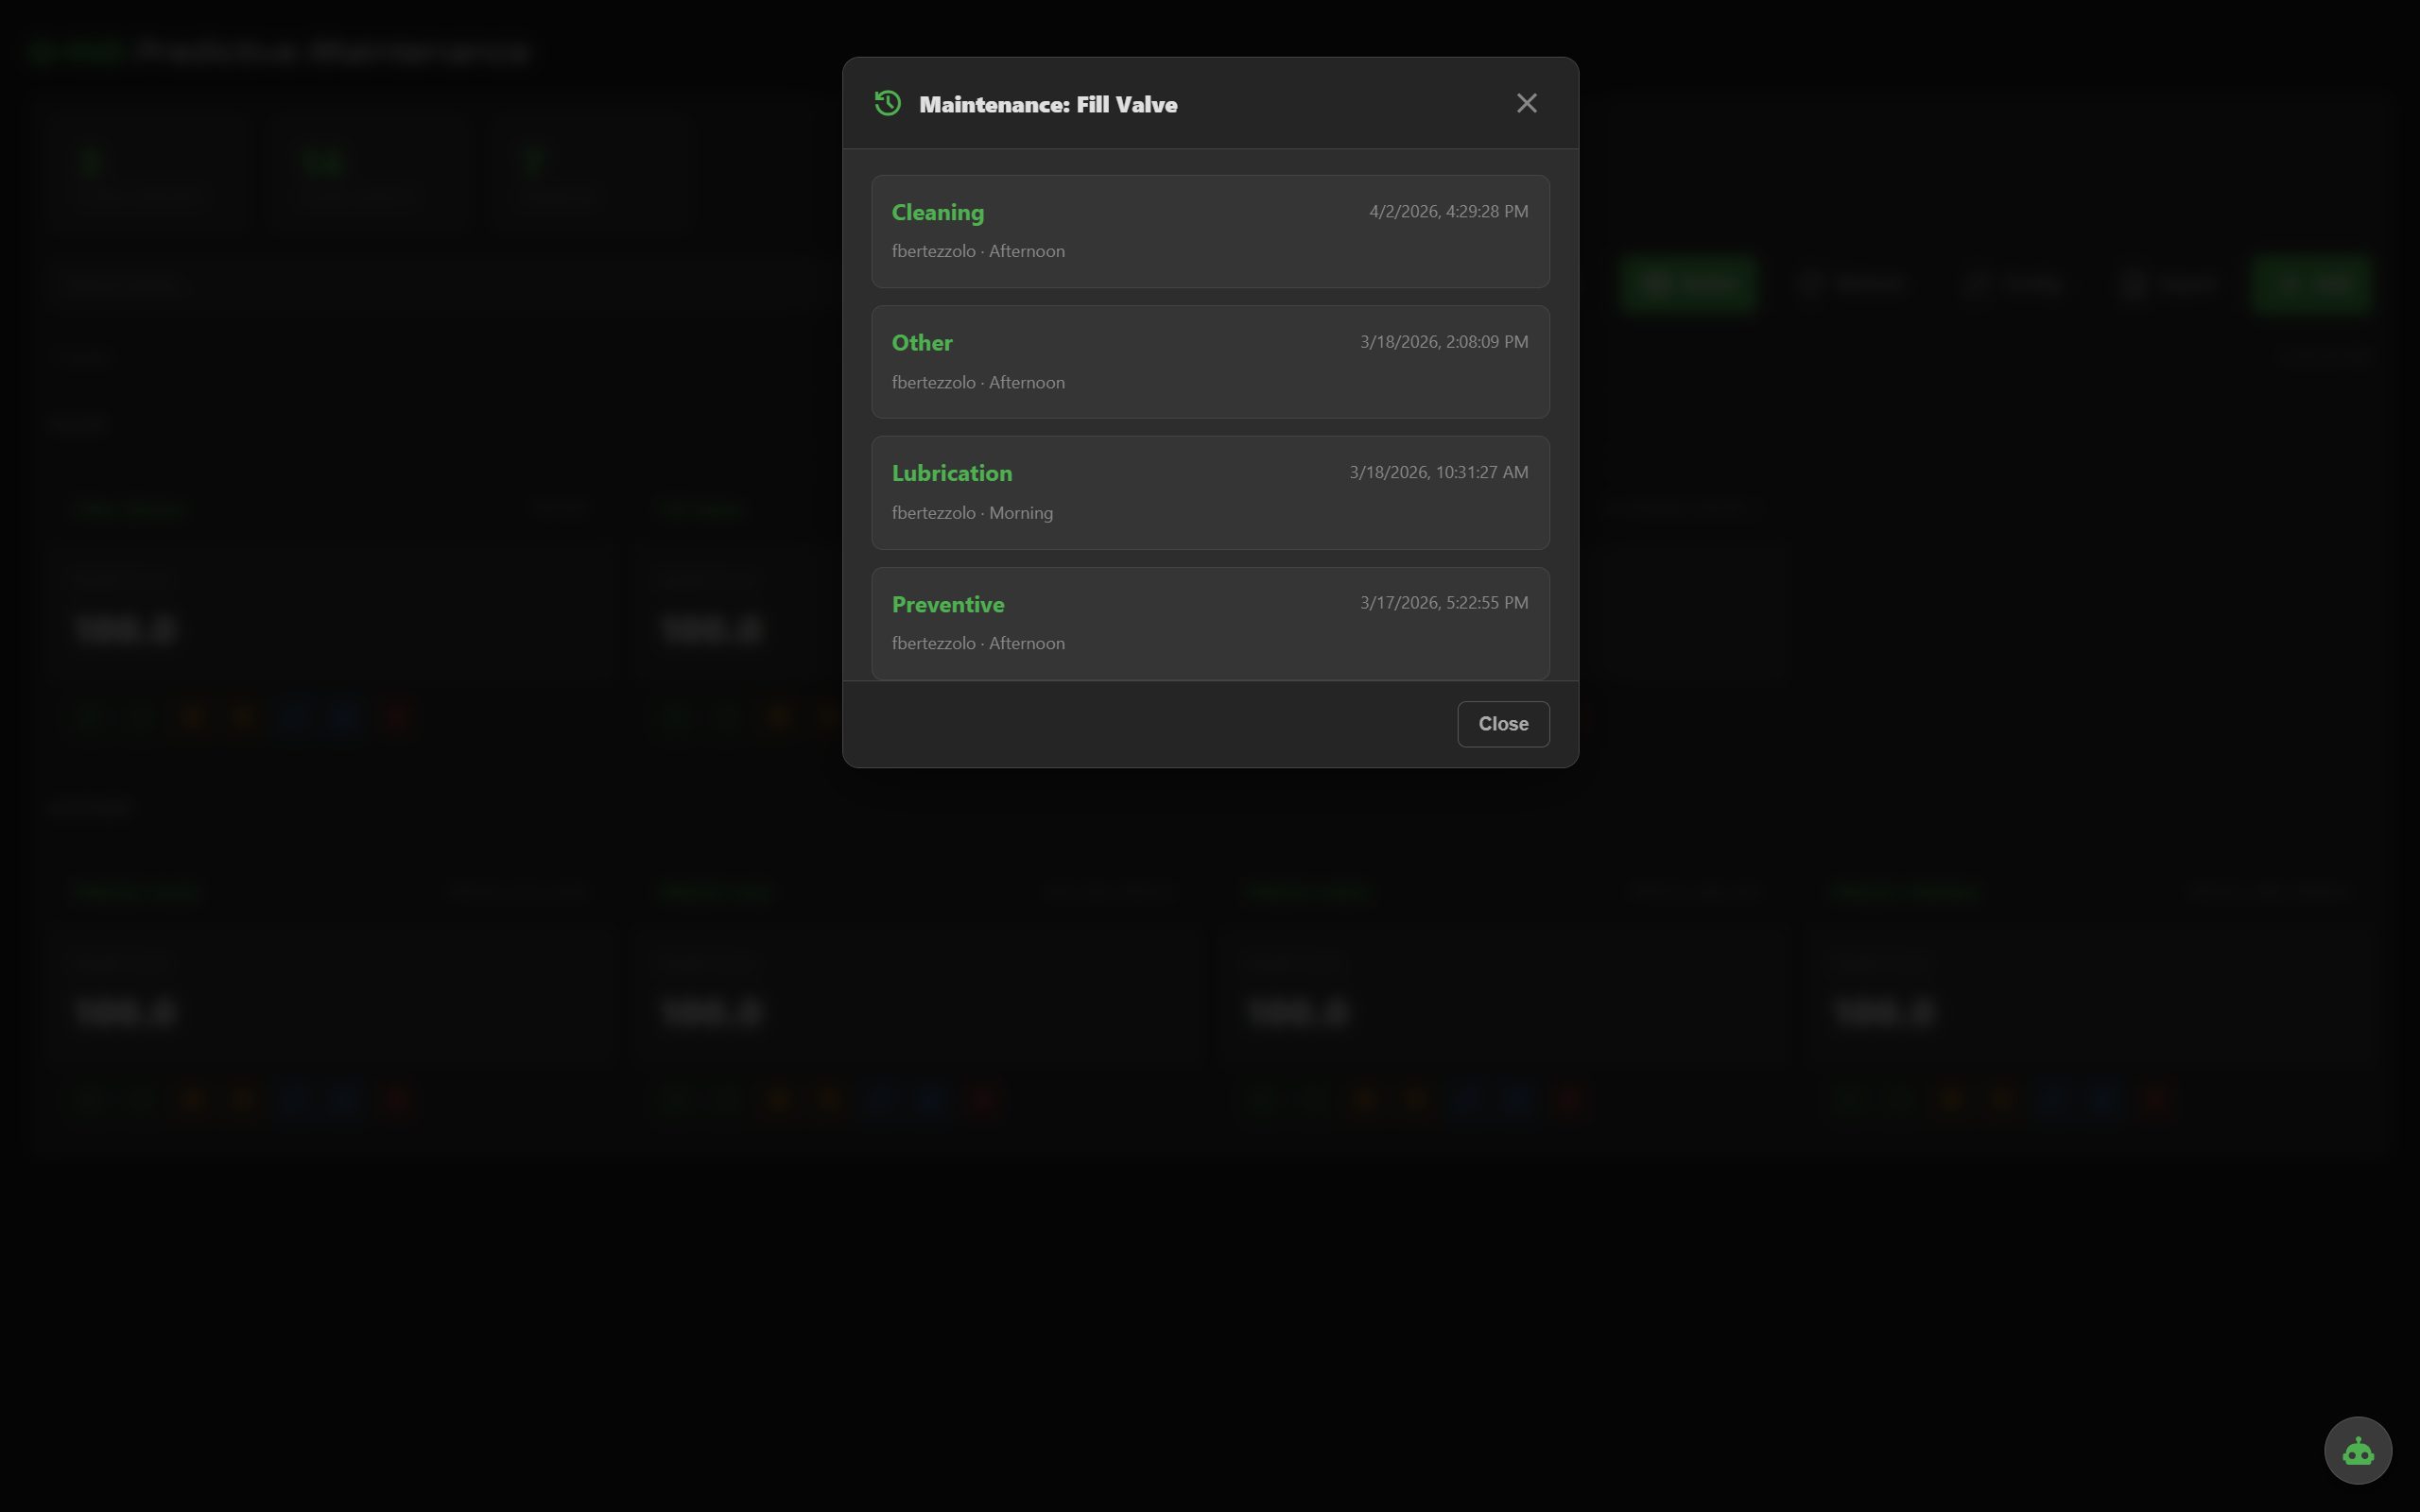
Every maintenance action logged with user, shift, type and description. Maintenance resets accumulators, clears anomaly state and feeds back into peer comparison.
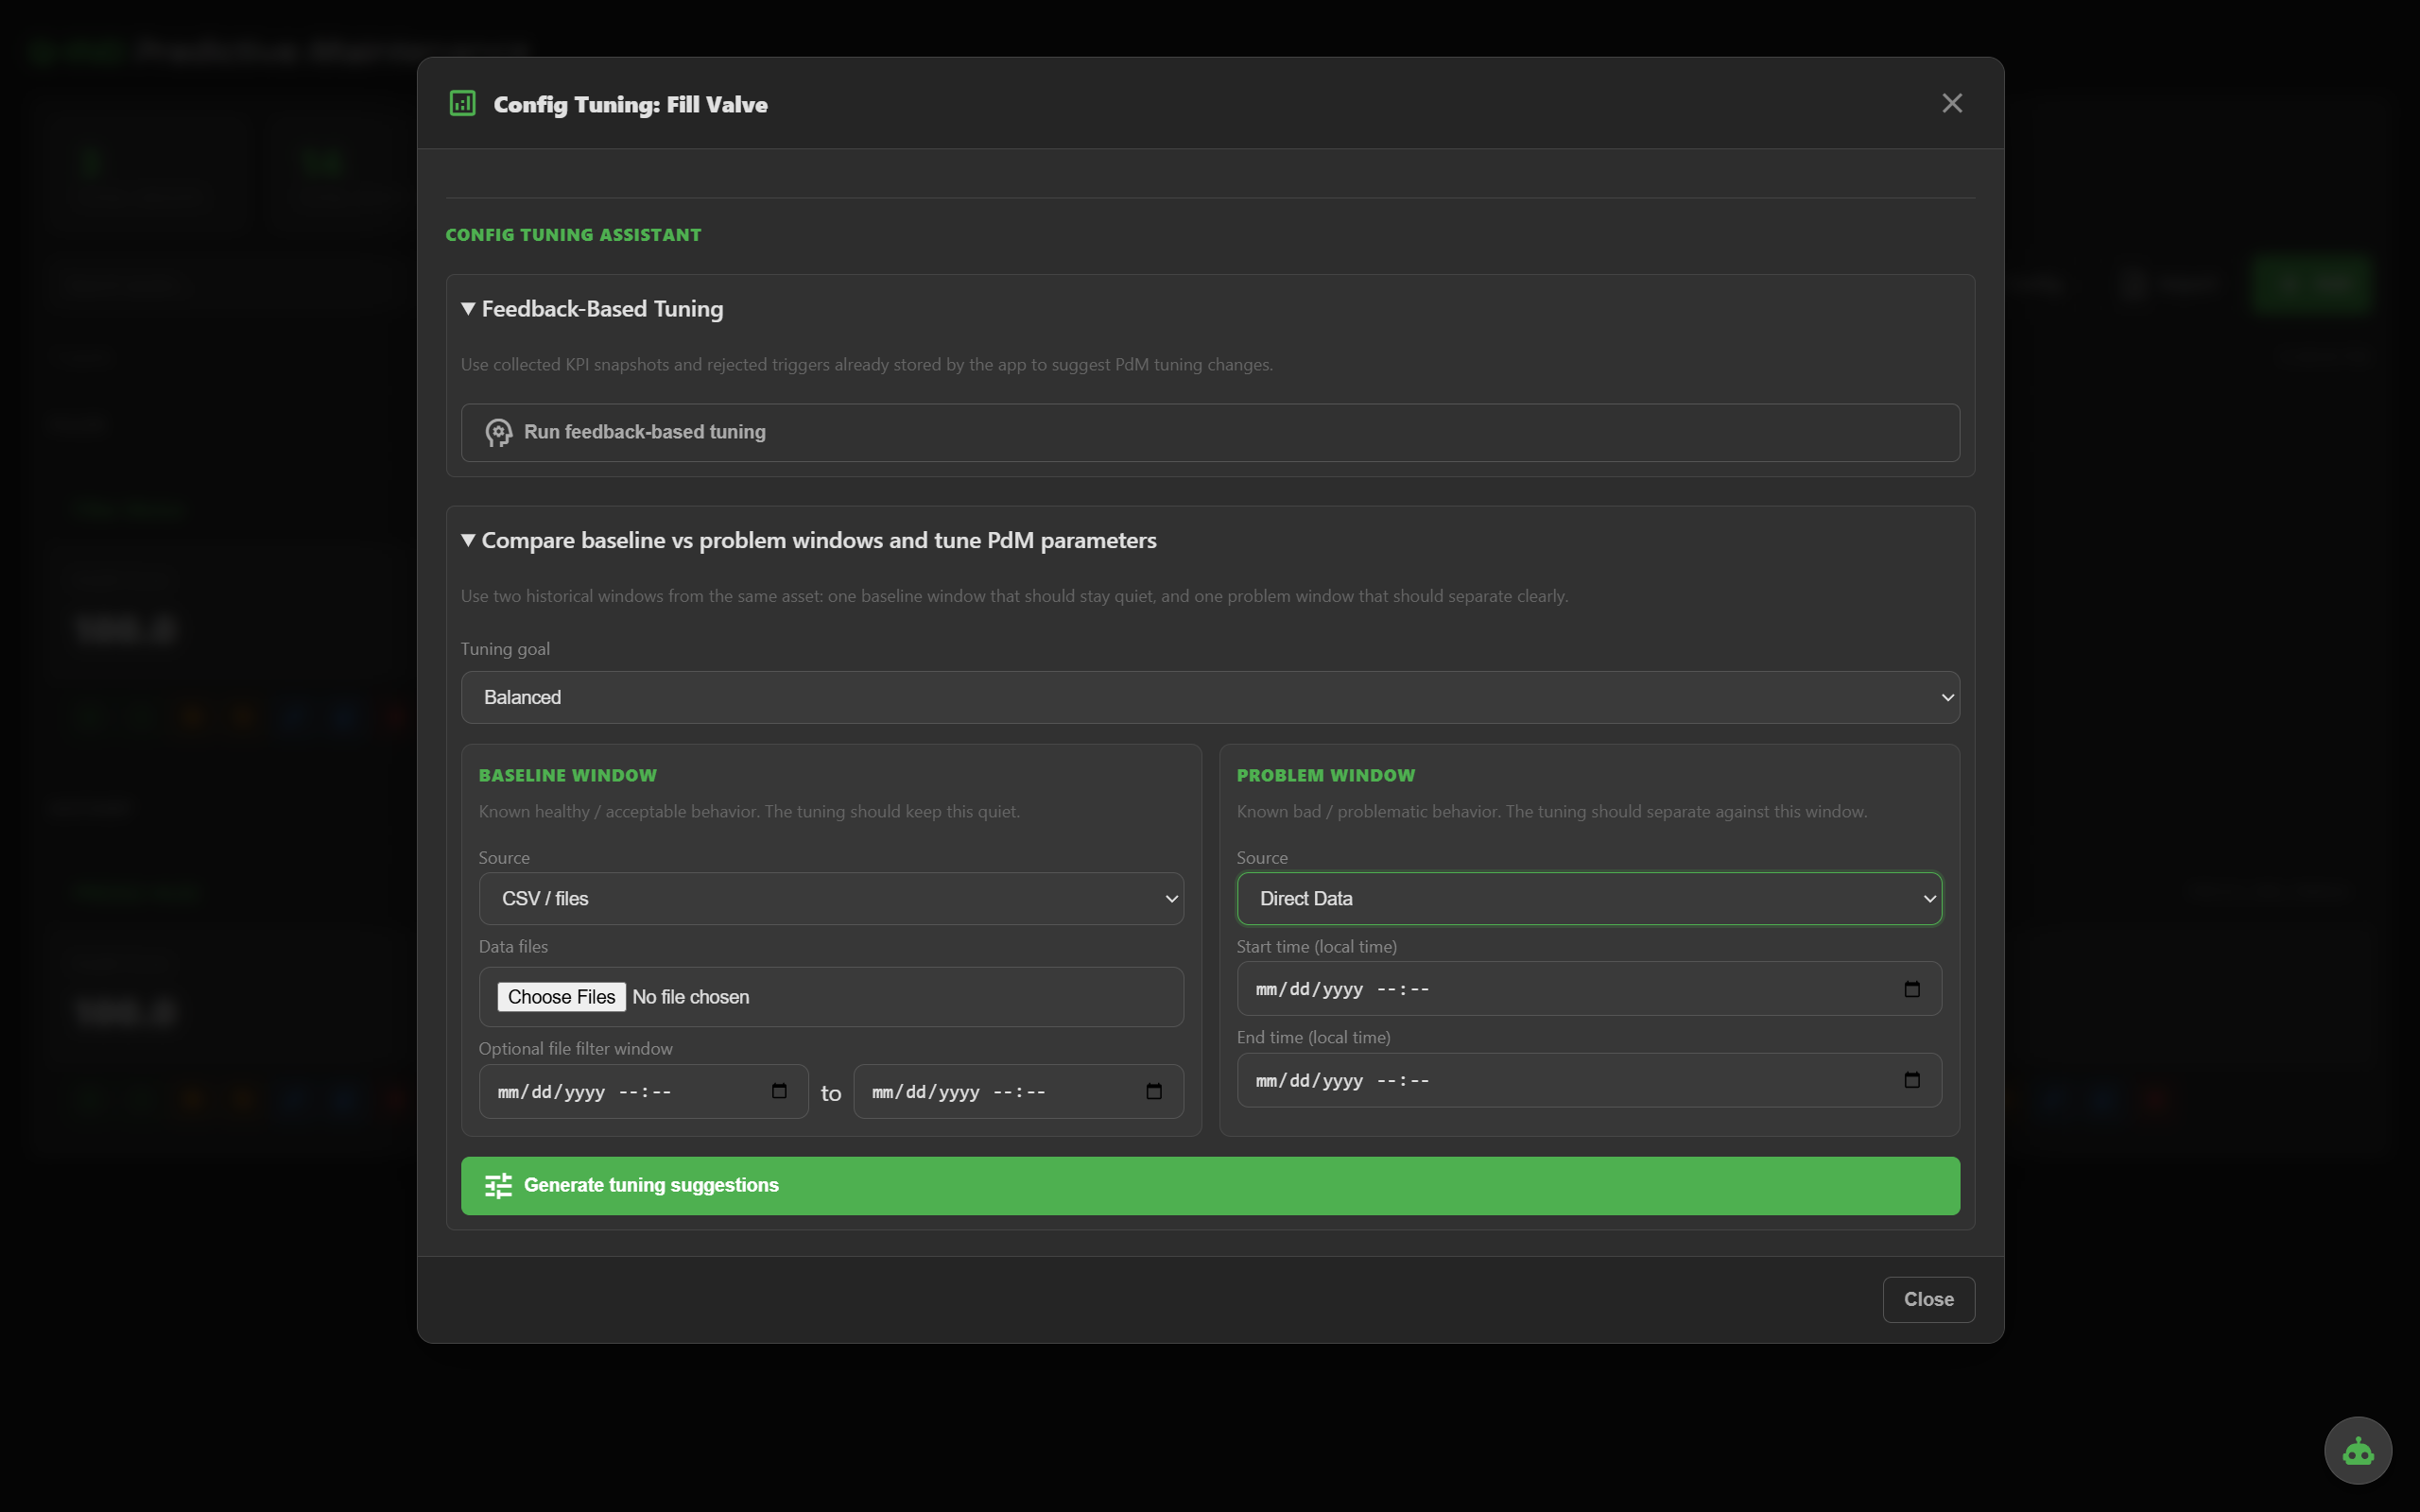
Q-PdM looks at the asset's recent behavior and recommends thresholds, windows and weights. Accept, edit or ignore — you stay in control.
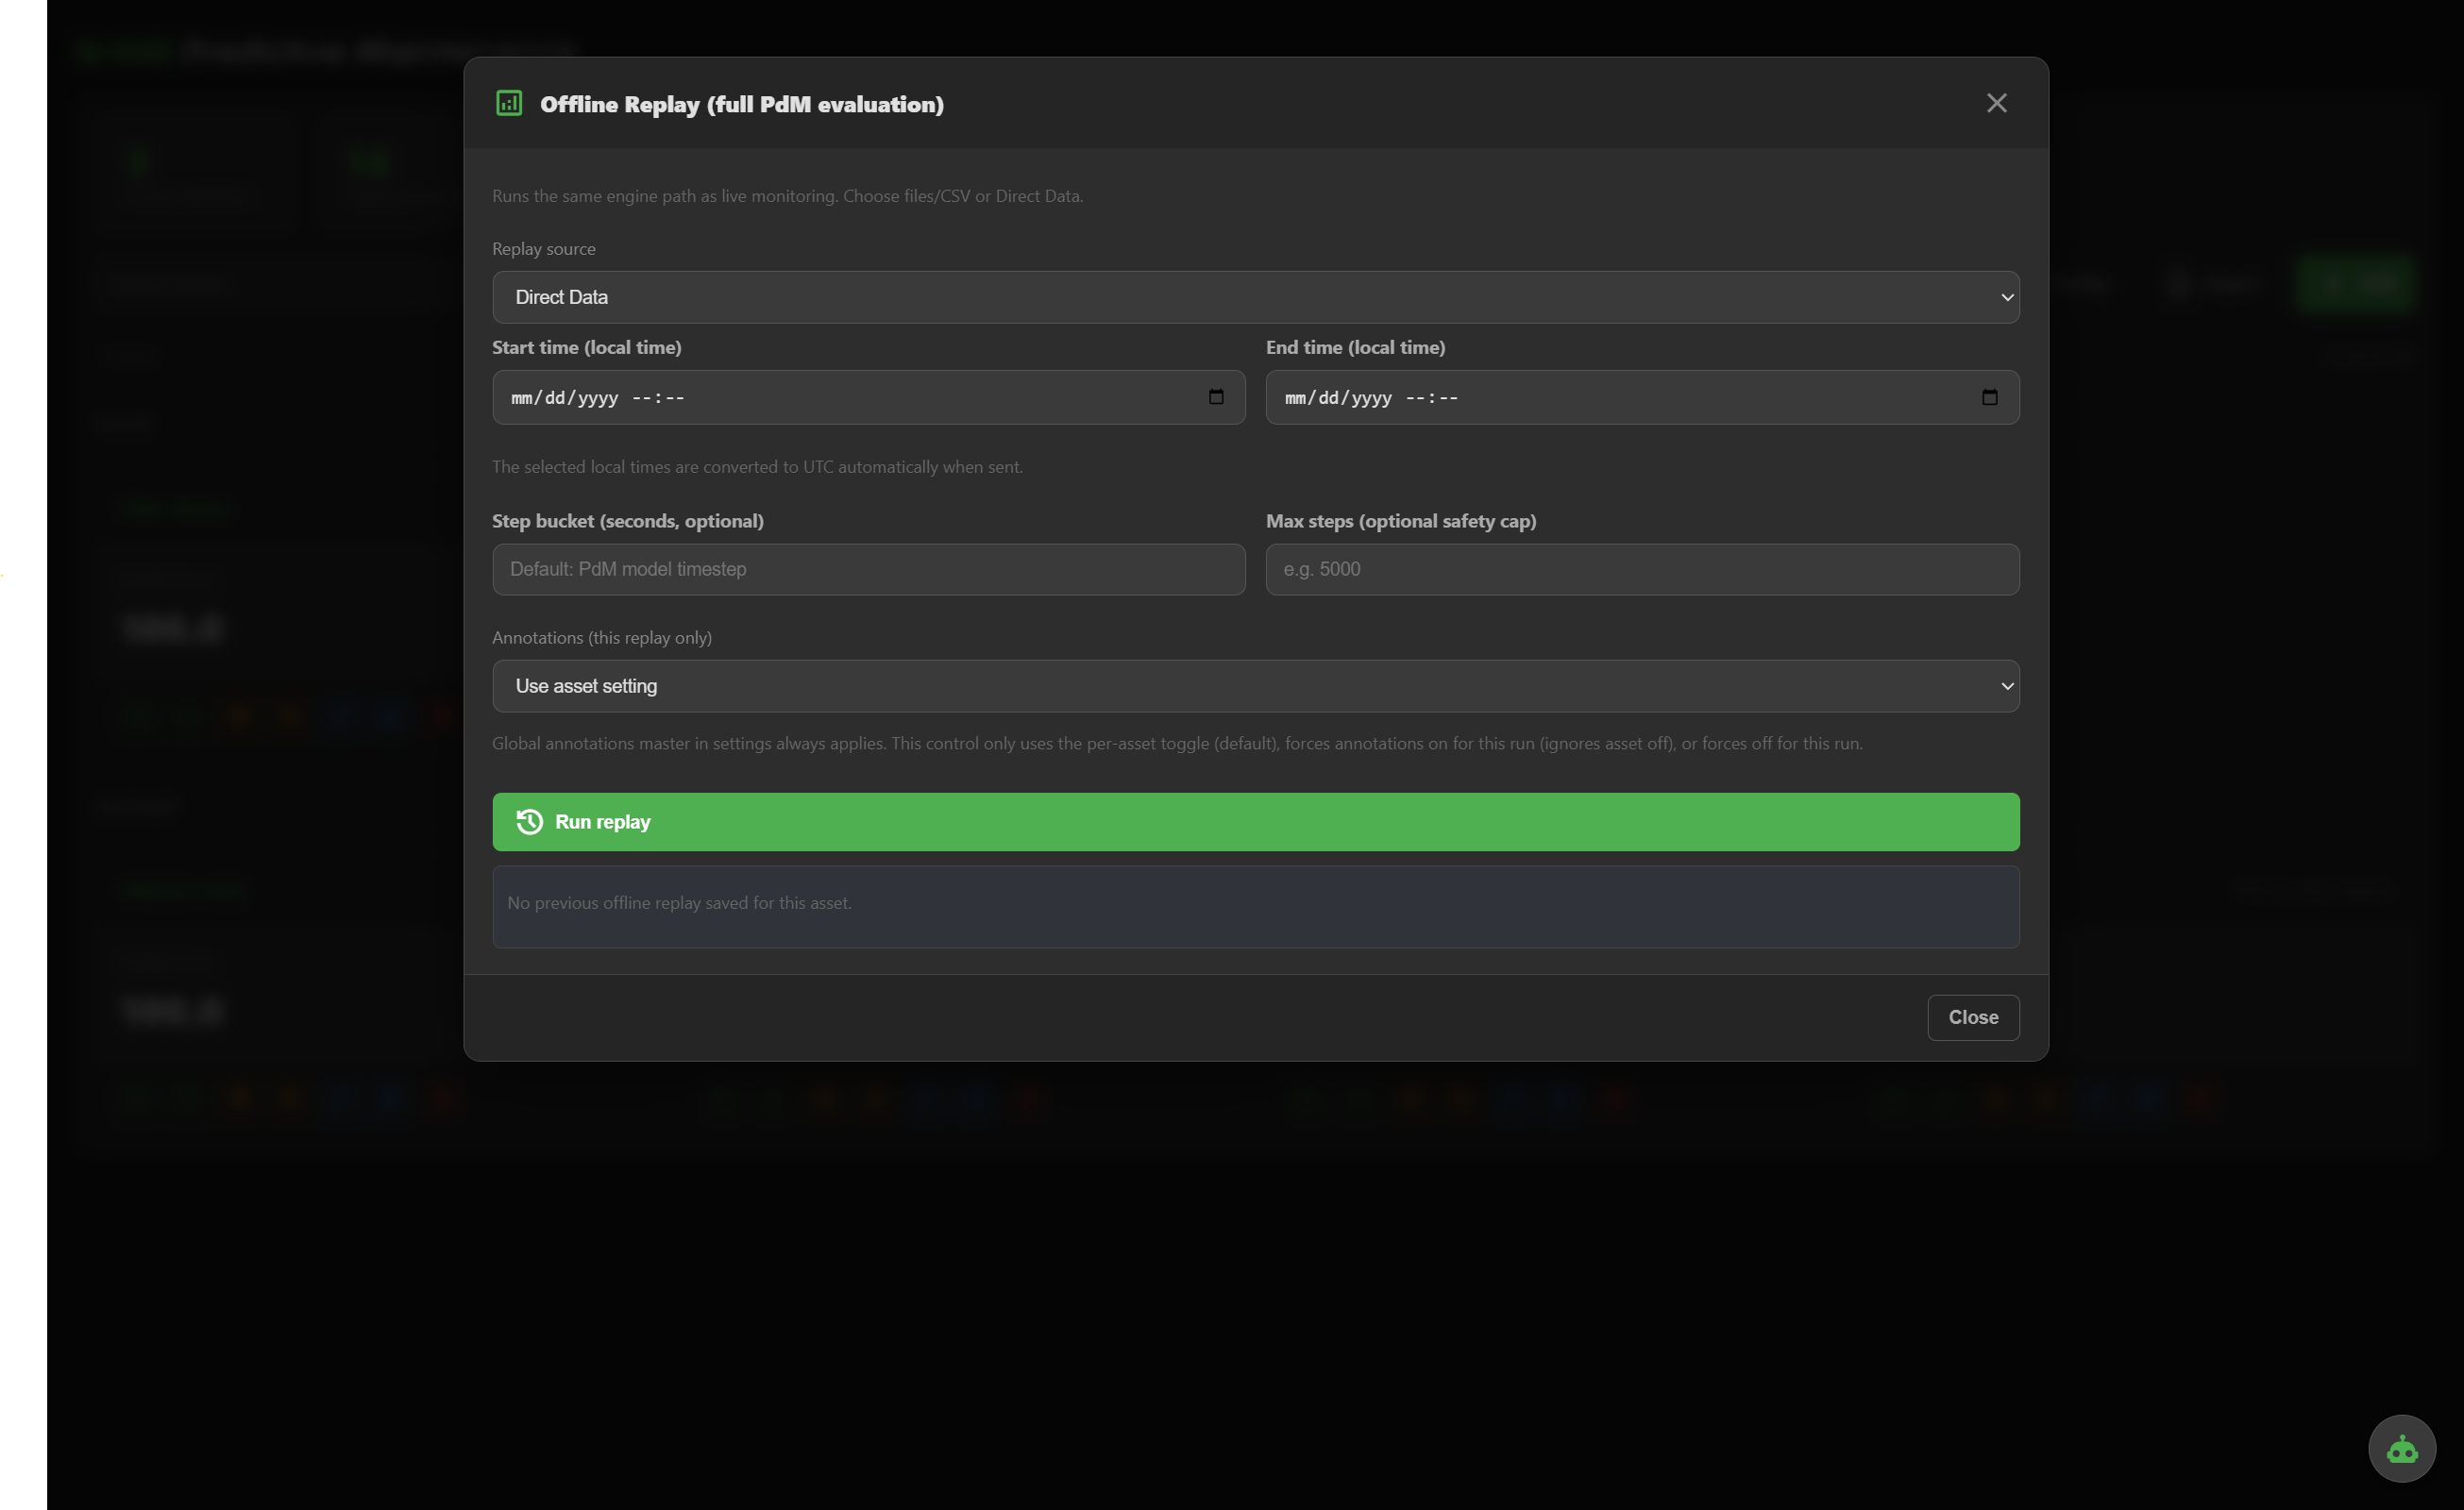
Re-run the whole evaluation engine against historical data — from CSV, QUANTUM historian or direct data API — to validate tuning before it goes live.
Built for messy industrial reality — gappy data, noisy sensors, real maintenance crews.
Q-PdM ships with the Industrial tier of QUANTUM Industrial Studio. No per-asset license, no per-tag fees. Tell us about your assets and we'll scope it with you.